It is challenging to systematically time financial markets, mostly because the uncertainty about expected asset returns is large (and especially so during periods of macroeconomic and market stress). As a result, investors are well advised to remain wary of strategies that rely on an elusive ability to accurately time financial markets. Instead, investors should focus on understanding and valuing macro uncertainty and its sources, measuring assets' exposures to this uncertainty, and aligning their strategic allocations with their tolerance for uncertainty and long-term macro conditions. They should also explore the potential benefits of hedging changes in macro uncertainty with low cost solutions.
Tactical multi-asset allocation strategies are often premised upon the a priori benefits of rebalancing around changes in macroeconomic and market conditions. In a varying macro and market environment, so the argument goes, the equity risk premium (the expected excess equity-return over bonds) also varies. Thus, timing these variations and realigning the relative equity-bond allocations according to a pre-defined rule could potentially benefit, compared to rebalancing to fixed strategic weights. However, the key question for investors is: in practice, do such tactical equity-bond reallocations actually deliver on their promise to systematically outperform their strategic counterpart, net of fees?
We propose to address this issue by backtesting the performance of two tactical (long-only) equity-bond strategies, relative to a given strategic portfolio rebalancing to fixed equity-bond allocations. More precisely, this strategic portfolio allocates 70% to the US cap-weighted equity market and 30% to a 10-year duration US treasury bond portfolio. The 70-30 equity-bond allocation was chosen to represent the average US public pension fund relative allocation to risky assets (including public equity, private equity and private real estate) . In this benchmark strategy, portfolio weights are rebalanced back to the 70-30 split quarterly.
As for the two tactical strategies, the first version relies on a commonly used rule, based on a relative long-term valuation measure - the equity market trend earnings-to-price ratio (inverse CAPE) relative to the bond market trend yield. The second strategy relies on our measure of macro uncertainty and long-term equity risk premia. In each case, allocations are rebalanced quarterly. Regardless of the rules employed, our analysis indicate that tactical strategies did not systematically outperform the strategic portfolio, even gross of fees.
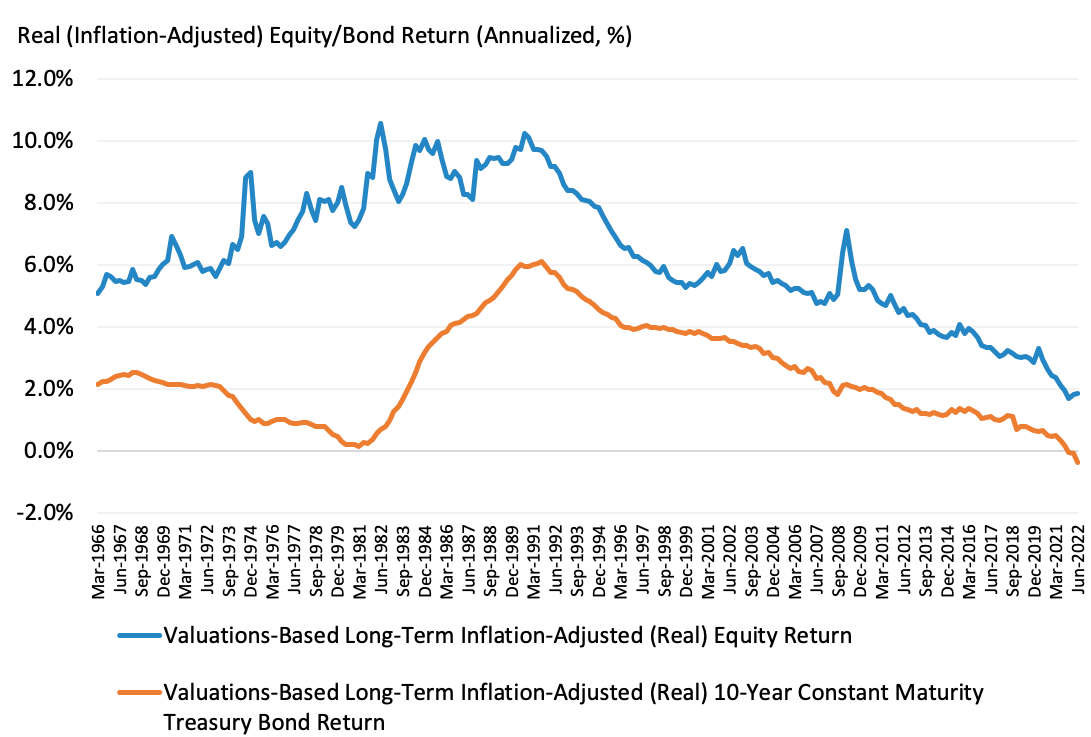
Let's examine the performance of these two tactical strategies in sequence. Exhibit 1 portrays, from March 1966 to June 2022, the evolution of long-term (10-year horizon) expected US equity market and 10-year US constant maturity treasury bond real returns, based on relative equity and bond valuations. Equity valuations are measured by the CAPE ratio developed by Robert J. Shiller. According to the Exhibit, the (annualised) long-term equity risk premium increased significantly from about 3% in March 1966 to 10% in June 1982, at the height of the oil crises. It then declined in a nearly continuous stretch, bottoming at about 1.5% in Q3 1999, consistent with the extreme high valuations preceding the TMT bubble burst. The risk premium increased again around the 2008 global financial crisis, reaching 5% in Q1 2009, as valuations bottomed. Since then, it has been averaging at a lower level of about 2.6%, and bottoming at about 1.7% during the pandemic. Accordingly, a long-term risk tolerant investor trusting these variations in risk premia would find it efficient (on an ex-ante basis) to deviate from its strategic 70-30 equity-bond allocations. More precisely, the optimal tactical allocation rule would dictate to increase (decrease) the relative equity allocations as the risk premium increases (decreases) . However, did these (ex-ante) deviations actually benefit in practice (ex-post)?
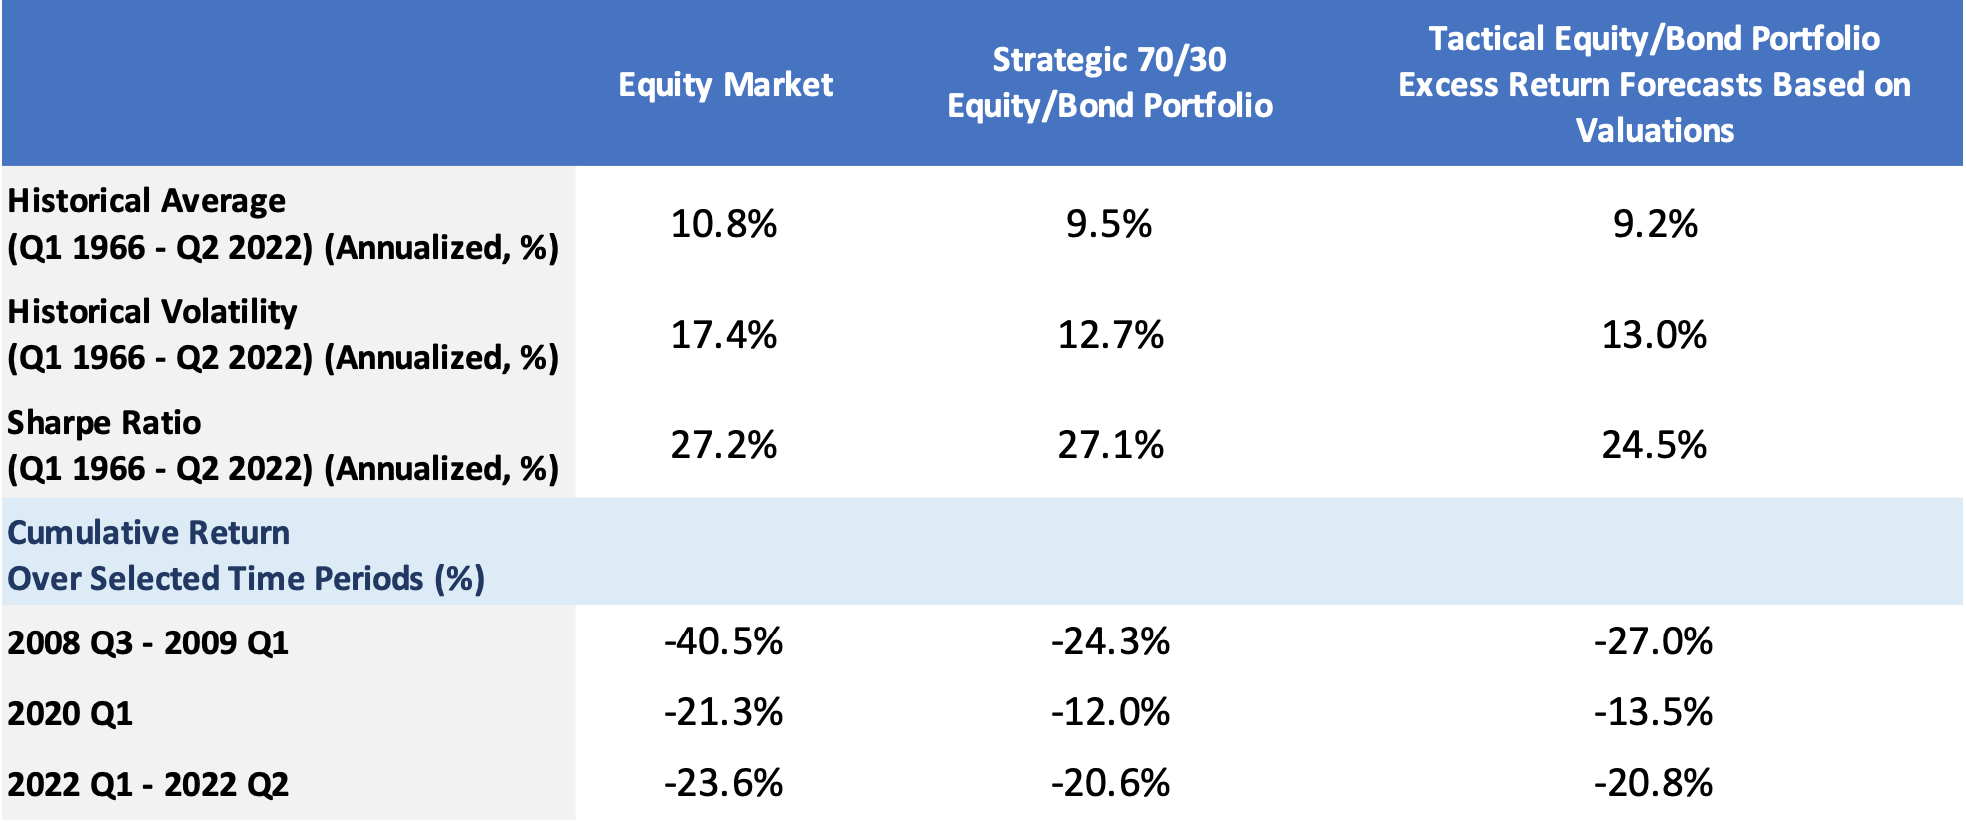
Exhibit 2 summarises the realised performance of this tactical strategy based on relative valuations from March 1966 to June 2022. In addition, it reports the performances of the strategic portfolio and of a broad US cap-weighed equity market portfolio. The principal conclusion is that the tactical strategy did not deliver on its promise of its alleged ability to profit from timing markets, even on a gross of fees basis. On average, the tactical strategy underperformed the strategic portfolio over the sample period, by about 30bps (annualised, gross of fees). Moreover, the tactical strategy experienced higher volatility (13% compared to 12.7%). It underperformed during periods of macro and financial markets stress, such as the 2008 global financial crisis (GFC) (-27% compared to -24.3%) and the Covid-19 pandemic (-13.5% compared to -12%). And as real (inflation-adjusted) interest rates increased in 2022, the year-to-date performance of the tactical strategy (as of June 2022) fared slightly worse (-20.8%) compared to the strategic portfolio (-20.6%). However, these are precisely the times when such tactical strategies claim to deliver higher returns - that is, if they could indeed time the markets accurately.
But perhaps the reason for the poor market timing is the valuations-based rule. Indeed valuation measures, taken alone, tend to be unreliable predictors of forward-looking equity returns (and risk premia), even directionally sometimes. In our view, this is because they fail to explicitly account for the impact of dividend growth risk and discounting, and how dividend growth risk and discount rates relate to macro uncertainty. Valuations-based measures have been shown to be particularly unreliable during the more recent times of ultra-low real (inflation-adjusted) interest rates during the pandemic (extreme high valuations but subsequent high realised returns) , and increasing real interest rates as experienced so far in 2022 (decreasing valuations and lower subsequent realised returns) .
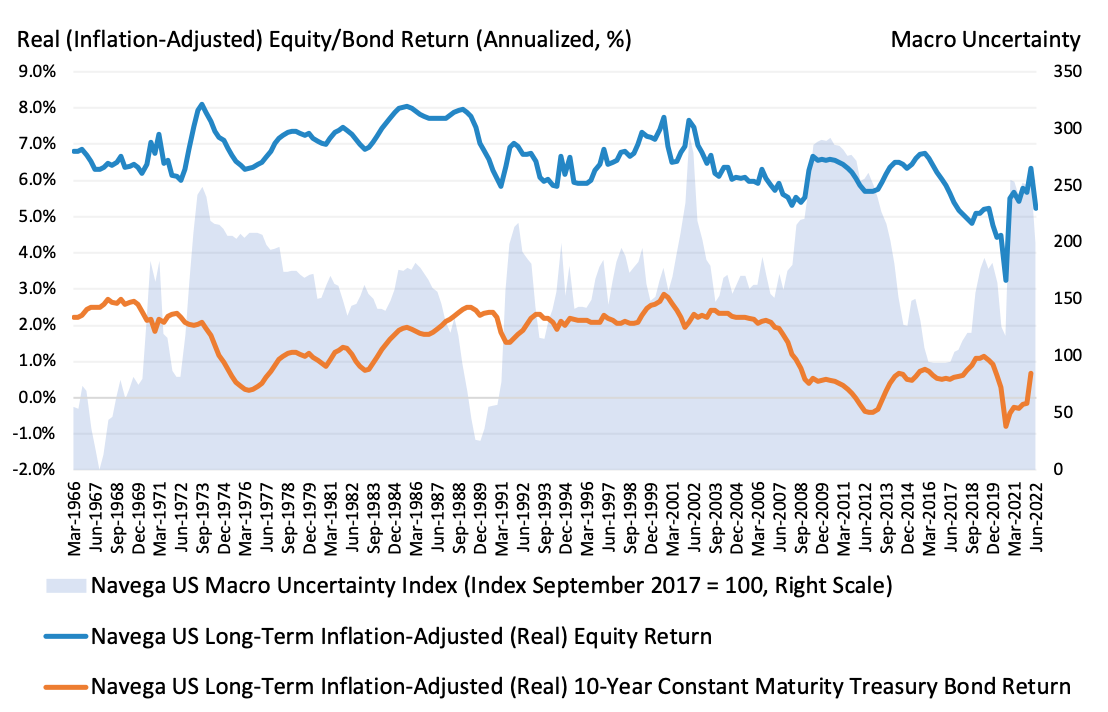
Would an alternative tactical rule have performed better by timing markets? To address this question, we consider a tactical rule based on our model-implied long-term return expectations . Exhibit 3 portrays the evolution of the Navega US long-term (10-year horizon) equity market and 10-year US constant maturity treasury bond real return from March 1966 to June 2022. As also shown in the Exhibit, these return expectations strongly depend on our measure of long-term macro uncertainty. For the most part until the 2008 GFC, the evolutions of our model-based and the valuation-based measure of equity risk premium were qualitatively similar. However, since the 2008 GFC, the two measures have been differing markedly. By contrast to the valuations-based measure, following the GFC, our model-implied equity risk premium remained persistently high until about 2016, driven by continued high levels of macro uncertainty. After decreasing, as uncertainty receded until about 2019, it rose back to its highest historically observed level (of about 6.1%), driven by the pandemic induced surge in macro uncertainty. Over the last two quarters, the equity risk premium has declined, with macro uncertainty receding (i.e. increased certainty about the continuation of sluggish long-term real economic growth trend).

Exhibit 4 summarises the performance of this macro uncertainty-based tactical strategy. According to the Exhibit, the macro uncertainty-based tactical strategy has performed better than the valuations-based strategy, both on average over the whole sample, and during the selected times of macro and market stress. However, it still did not manage to outperform the strategic portfolio (even gross of fees). The reason is because the uncertainty-based tactical allocations do not deviate much from the strategic weights. Indeed, by contrast to the valuations-based tactical strategy rule, our model-optimised portfolio explicitly takes into account investors' confidence in the inputs to the portfolio decision. These are the expected returns and risk measures themselves. This confidence about the model depends both on a given investor's tolerance for uncertainty, but also on our measure of statistical reliability (or "model uncertainty") of expected returns and risk, and their modeling assumptions - given the information available to the investor (i.e. past observations of macro variables and asset returns). Given the acutely high level of uncertainty around times of macro and financial markets stress (2008 GFC and Covid-19 for example), even an uncertainty tolerant investor would doubt the ability of timing markets under such conditions, and place less confidence in the expected changes in risk premia implied by our own models. In turn, investors would actually find it efficient not to deviate much from the strategic portfolio.
In addition, our model-optimised portfolio also explicitly incorporates equilibrium effects. Simply put, on balance, all investors' portfolio holdings should ultimately add-up to the "market" portfolio of all assets held in their capitalisation weight. Thus, investors cannot all deviate away from this "market portfolio" in the same direction, as would be implied by common valuations-based tactical strategies! By contrast, our uncertainty-based tactical strategy implies that as some uncertainty tolerant investors increase (decrease) their equity allocations, away from the "market" portfolio, some uncertainty averse investors correspondingly decrease (increase) their equity allocations. In the context of the present analysis, none of the investors find it efficient to significantly deviate from their strategic holdings, and across investors, portfolios do add-up to the cap-weighted "market".
The takeaway for investors is that chasing returns by attempting to time markets is a fool's errand. Instead, investors should focus on aligning long-term strategic allocations with their tolerance to macro uncertainty and long-term macro conditions, together with an understanding of the sources of this uncertainty, and its impact on long-term asset returns. Investors should also explore the potential benefits from hedging changes in macro uncertainty with low cost solutions. As we will show in subsequent notes, this exploration requires looking for investment opportunities beyond the cap-weighted stock market and bonds.
This document is for informational purposes only. This document is intended exclusively for the person to whom it has been delivered, and may not be reproduced or redistributed to any other person without the prior written consent of Navega Strategies LLC (“Navega”). The information contained herein is based on Nageva’s proprietary research analytics of data obtained from third party statistical services, company reports or communications, publicly available information, or other sources, believed to be reliable. However, Navega has not verified this information, and we make no representations whatsoever as to its accuracy or completeness. Navega does not intend to provide investment advice through this document. This document is in no way an offer to sell or a solicitation of an offer to buy any securities. Investing in securities involves risk of loss, including a loss of principal, that clients should be prepared to bear. Past performance is not indicative of future results, which may vary materially. While this summary highlights important data, it does not purport to capture all dimensions of risk. The methodology used to aggregate and analyze data may be adjusted periodically. The results of previous analyses may differ as a result of those adjustments. Navega has made assumptions that it deems reasonable and used the best information available in producing any calculations herein. Statements that are nonfactual in nature, including opinions, projections and estimates, assume certain economic conditions and industry developments and constitute only current opinions that could be incorrect and are subject to change without notice. All information provided herein is as of the delivery date the document (unless otherwise specified) and is subject to modification, change or supplement in the sole discretion of Navega without notice to you. This information is neither complete nor exact and is provided solely as reference material with respect to the services offered by Navega. Information throughout this document, whether stock quotes, charts, articles, or any other statement or statements regarding market or other financial information, is obtained from sources which we and our suppliers believe reliable, but we do not warrant or guarantee the timeliness or accuracy of this information. The information presented here has not been personalized, and is not based on the financial circumstances of the recipient. This information may not be applicable to your particular financial needs, and should not, by itself, be used to make determinations regarding the purchase or sale of securities, or other investment decisions.
The model performance information presented is based on the application of Navega’s factor analysis, backtested against actual historical data. “Backtesting” is a process of objectively simulating historical performance information by applying a set of rules backward in time. The results of the application of Navega’s model do not reflect actual performance or actual historical data. Such models are prepared with the full benefit of hindsight, and it is not likely that similar results could be achieved in the future.
The model portfolios were constructed by Navega with the benefit of hindsight to illustrate certain performance metrics. The performance shown was not actually achieved by any investor. The investments in these hypothetical portfolios were selected with the full benefit of hindsight, after performance over the period shown was known. It is not likely that similar results could not be achieved in the future. The hypothetical portfolios presented here are purely illustrative, and representative only of a small sample of possible scenarios.
The projections shown do not represent actual performance, and are based on assumptions which may not occur. It is possible that the markets will perform better or worse than shown in the projections, the actual results of an investor who invests in the manner these projections suggest will be better or worse than the projections, and an investor may lose money by relying on these projections.