Global equities bounced back in October, thus reversing their end of September losses. The latest rise means a nearly uninterrupted rise in market value since the pandemic-induced downturn in March 2020: indeed, valuations are as high as they've been since the 2000 TMT bubble. Although investors have extended their portfolio gains through 2021 to date, high valuations and fears about inflation-driven increases in interest rates are possible sources of concern about future equity returns. Our models, however, suggest that the levels of real interest rates and equity valuations are consistent with low levels of long-term real economic growth AND high levels of macroeconomic uncertainty. This combination of macroeconomic factors thus produces high levels of equity risk premia (or ex-ante expected excess equity return over the 10-year (constant maturity) treasury yield).
Ultimately, the path for future realized returns remains closely linked to future growth, macro growth uncertainty and inflation trends. For example, a growth recovery-driven rise in interest rates could well help further boost valuations and returns. Practically speaking, given the sheer uncertainty about these forward-looking macro trends, investors are well advised to
Understand the fundamental sources of macro growth uncertainties
Form forward-looking scenarios about these sources, and
Systematically evaluate their impact on returns
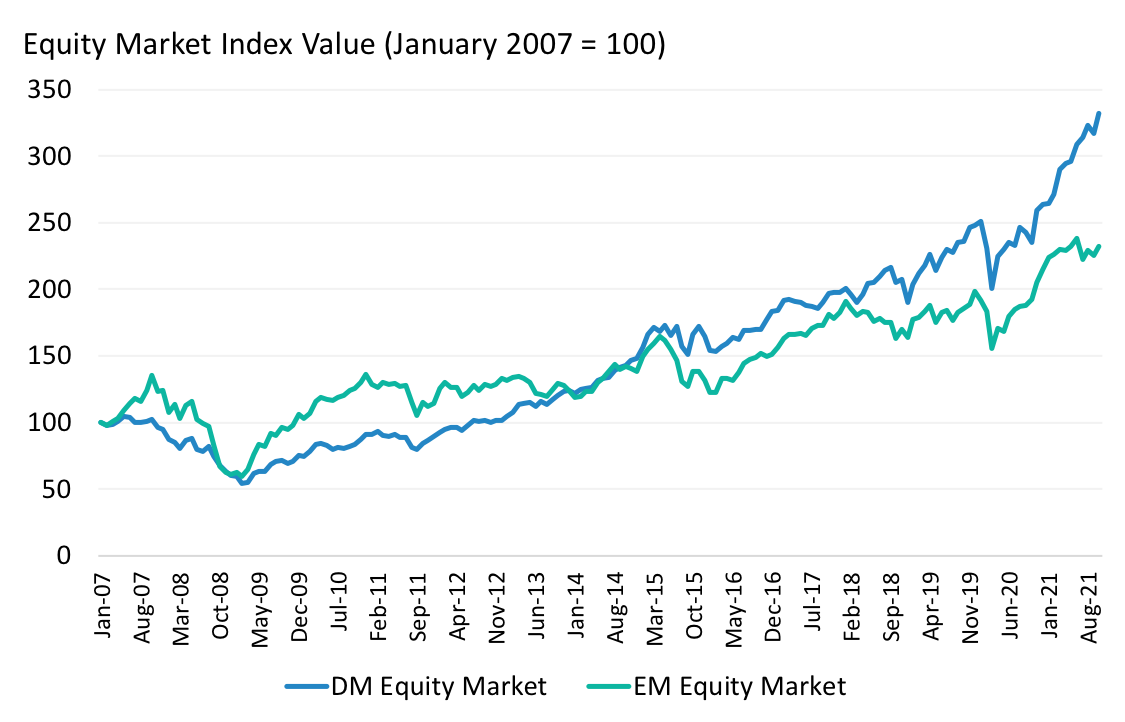
As shown in Exhibit 1, both developed (DM) and emerging (EM) equity markets have largely shrugged off their drawdowns experienced at the start of the pandemic. Our previous paper indicated that this seemingly unstoppable rise in equity valuations was primarily driven by ultra low interest rates.
Low real and nominal rates are consistent with our models' baseline scenario of low (relative to the historical average) long-term global economic growth. It is worth noting that trend growth was declining pre-pandemic. As summarized in Exhibit 2, low real rates reflect investors' demand for insurance against high uncertainty about low long-term real economic trend growth. In the absence of high uncertainty about trend growth, real rates would more closely approximate long-term trend growth. Trend real growth is in turn driven by labor force and TFP trend growth rates, both of which are projected to remain muted and well below their historical average. By extension, long-term growth uncertainty, the risk priced into asset markets, is driven by uncertainty about labor force and TFP growth.
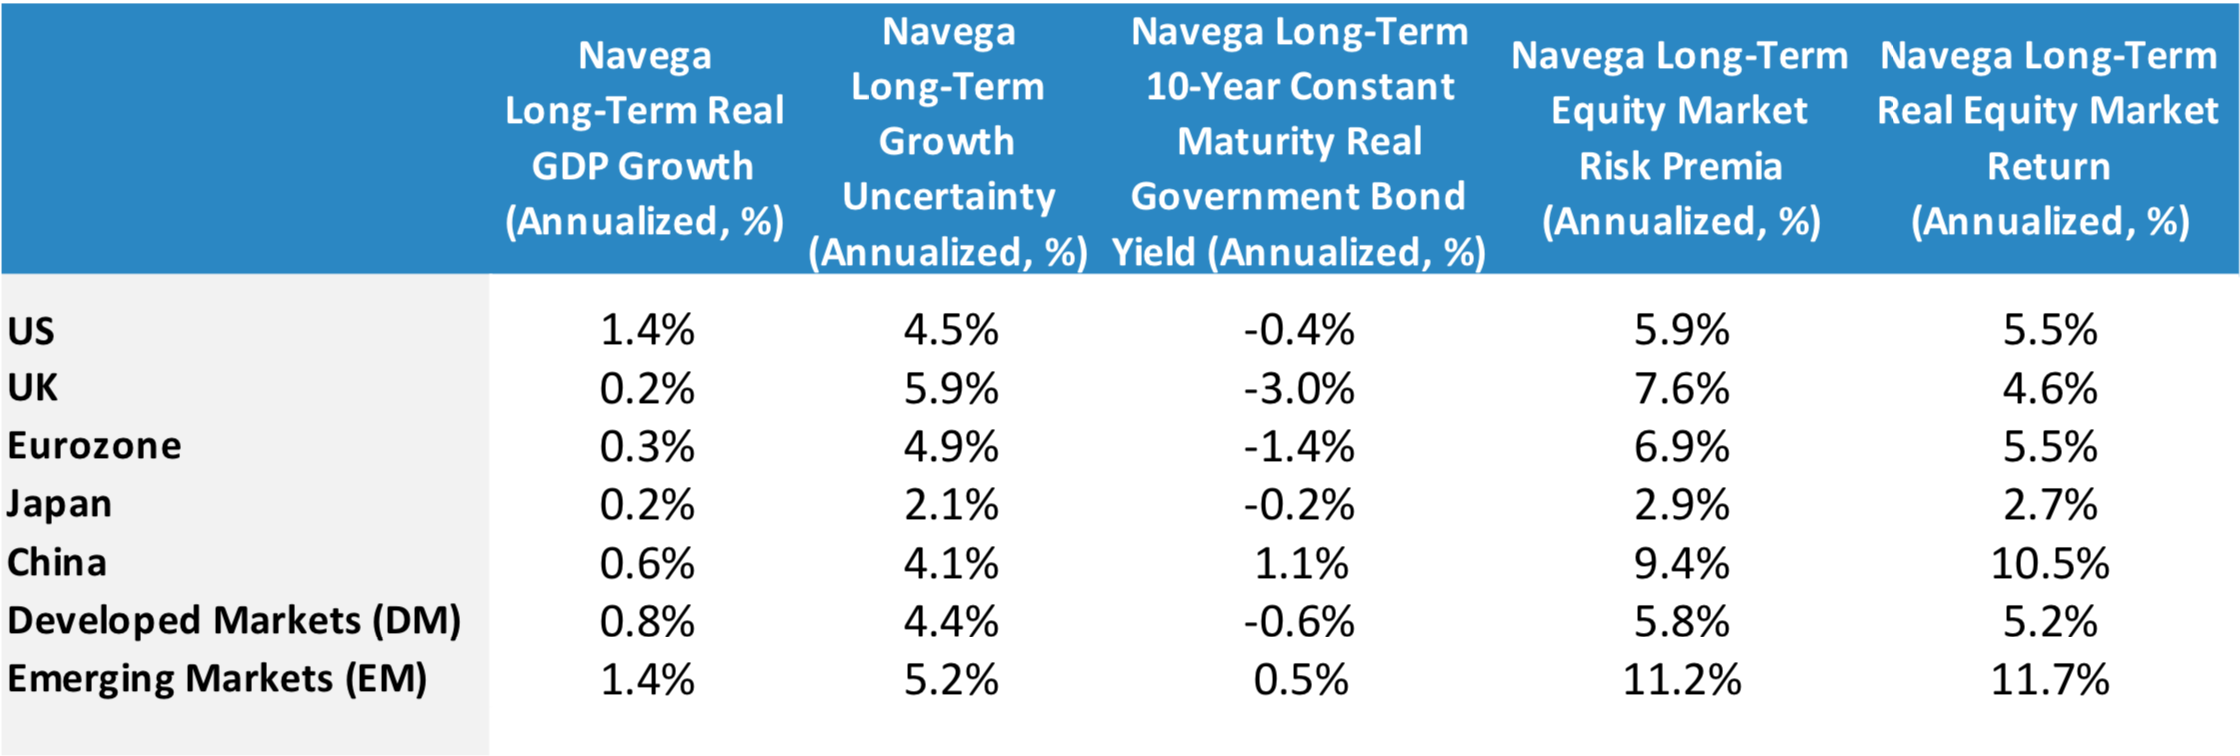
At the same time, and as shown in Exhibit 2, high macro growth uncertainty is also consistent with high equity risk premia. Indeed, the equity risk premium reflects investors' required compensation for exposure to macro growth-sensitive equity cash-flows (or dividends).
The main conclusion from these results is that while valuations are high, relative to historical standards, equity markets could still remain attractive relative to bonds for long-term investors (due to high levels of uncertainty around long-term growth). That said, could realized returns be lower going forward? Or could they become even higher? According to our models, paths for future equity returns depend on future paths for long-term economic growth, growth uncertainty and inflation.
For example, one scenario would envision stagflation: a continued decline in long-term real economic growth expectations combined with higher inflation expectations over the next 10 years. The decline in growth would be similar to that experienced since 2008 - a 90bps decline from 1.5% (current baseline) to 0.6%. With growth uncertainty remaining at current high levels, to help sustain ballooning debt-to-gdp ratios, high inflation risk ends up materializing into increased long-term inflation expectations - from 2.3% to 4.6% per year. Focusing on the US, Exhibit 3 applies our models to show the scenario impact on US 10-year Constant Maturity treasury yields and US real equity market returns. According to the Exhibit, on average over the next 10 years, nominal yields would rise from 2% (baseline) to 3.4%. Nominal equity market returns would decline somewhat, from 7.9% to 5.1%. (Real equity returns over the 10-year period would decline more dramatically, from 5.5% to 1.1%). Although real returns have decreased, they are still positive. Thus, equities would still offer a hedge against an increase in expected inflation.

Alternatively, regulatory changes (such as anti-trust laws that increase competitivity) and directed technological innovations could combine to lead a recovery of long-term TFP and real GDP growth rates back to their pre-2008 GFC crisis trend. In this scenario, macro uncertainty would revert back from the current highest historically observed level (4.5%) to its lowest level (2.9%). Lower growth uncertainy also implies that inflation expectations remain unchanged. According to Exhibit 3, on average over the next 10 years, this alternative scenario would imply a combined rise in nominal bond yields to 3.9%, and nominal equity returns to 11.1%. In this scenario, real equity returns would be 9.1% versus 5.9% in the baseline case. Thus, what matters for real equity returns is why nominal interest rates increase (or decrease), not the mere fact of changes in rates.
The main takeaway from these results is that investors should focus on the long-term drivers of real economic growth (i.e. TFP and labor force growth) and growth uncertainty rather than shorter-term changes in valuations, inflation and interest rates. Moreover, they should systematically evaluate the impact of alternative scenarios of TFP and the labor force on future bond yields and returns. Equities remain attractive relative to bonds under our baseline scenario of continued high uncertainty about a low real growth trend - consistent with ultra-low interest rates driving high valuations. Going forward, a rise in interest rates could be inflation or real growth driven. However, the former channel would lead to a decline in equity returns, while the latter would further boost valuations and returns. In short- what happens to long-term returns depends on what happens to real growth.
This document is for informational purposes only. This document is intended exclusively for the person to whom it has been delivered, and may not be reproduced or redistributed to any other person without the prior written consent of Navega Strategies LLC (“Navega”). The information contained herein is based on Nageva’s proprietary research analytics of data obtained from third party statistical services, company reports or communications, publicly available information, or other sources, believed to be reliable. However, Navega has not verified this information, and we make no representations whatsoever as to its accuracy or completeness. Navega does not intend to provide investment advice through this document. This document is in no way an offer to sell or a solicitation of an offer to buy any securities. Investing in securities involves risk of loss, including a loss of principal, that clients should be prepared to bear. Past performance is not indicative of future results, which may vary materially. While this summary highlights important data, it does not purport to capture all dimensions of risk. The methodology used to aggregate and analyze data may be adjusted periodically. The results of previous analyses may differ as a result of those adjustments. Navega has made assumptions that it deems reasonable and used the best information available in producing any calculations herein. Statements that are nonfactual in nature, including opinions, projections and estimates, assume certain economic conditions and industry developments and constitute only current opinions that could be incorrect and are subject to change without notice. All information provided herein is as of the delivery date the document (unless otherwise specified) and is subject to modification, change or supplement in the sole discretion of Navega without notice to you. This information is neither complete nor exact and is provided solely as reference material with respect to the services offered by Navega. Information throughout this document, whether stock quotes, charts, articles, or any other statement or statements regarding market or other financial information, is obtained from sources which we and our suppliers believe reliable, but we do not warrant or guarantee the timeliness or accuracy of this information. The information presented here has not been personalized, and is not based on the financial circumstances of the recipient. This information may not be applicable to your particular financial needs, and should not, by itself, be used to make determinations regarding the purchase or sale of securities, or other investment decisions.
The model performance information presented is based on the application of Navega’s factor analysis, backtested against actual historical data. “Backtesting” is a process of objectively simulating historical performance information by applying a set of rules backward in time. The results of the application of Navega’s model do not reflect actual performance or actual historical data. Such models are prepared with the full benefit of hindsight, and it is not likely that similar results could be achieved in the future.
The model portfolios were constructed by Navega with the benefit of hindsight to illustrate certain performance metrics. The performance shown was not actually achieved by any investor. The investments in these hypothetical portfolios were selected with the full benefit of hindsight, after performance over the period shown was known. It is not likely that similar results could not be achieved in the future. The hypothetical portfolios presented here are purely illustrative, and representative only of a small sample of possible scenarios.
The projections shown do not represent actual performance, and are based on assumptions which may not occur. It is possible that the markets will perform better or worse than shown in the projections, the actual results of an investor who invests in the manner these projections suggest will be better or worse than the projections, and an investor may lose money by relying on these projections.