The 2022 experience has so far been rather dismal for US stock markets. Following 21 months of nearly uninterrupted rise since April 2020, YTD losses are now approaching the 20% mark! While this is certainly no good omen for equity investors, the recent commentaries putting an obsessive blame on inflation (and by misconstrued extrapolation, central banks) are not helpful either. Worse, they do not serve investors, corporate nor policy decision makers well. By contrast, our models point to the rise in real (inflation-adjusted) interest rates as the likely culprit. In turn, our models indicate that the increase in real rates has been driven by a relative decline in uncertainty (i.e. increased certainty) about sluggish long-term real economic growth - not an increase in inflation!
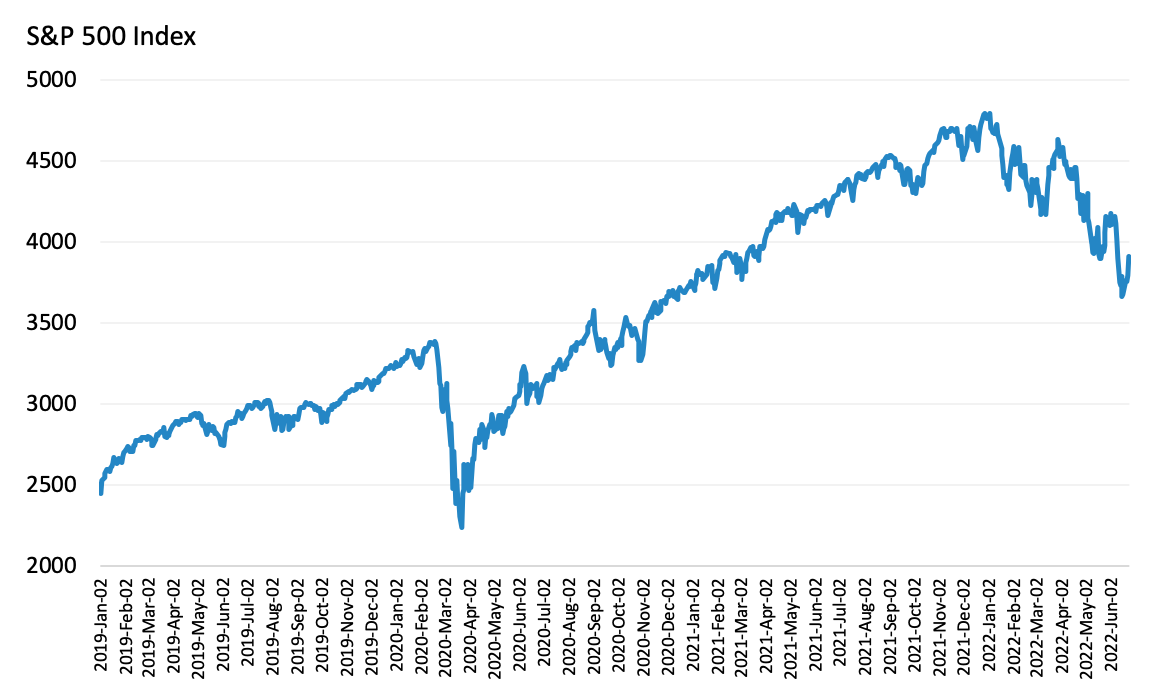
Exhibit 1 portrays the performance of the S&P 500 Index since January 2019. It stands out from the Exhibit that US stock markets experienced a spectacular and almost uninterrupted rise from March 23rd, 2020 through December 2021 - a 114% cumulative increase. A remarkable recovery given the dramatic -34% fall experienced at the start of the pandemic (from February 19th to March 23rd 2020). Since January 2022 however, the performance has been rather bleak, with a nearly continuous decline of -18%, year-to-date.
Market commentaries, for the most part, have been quick to attribute losses in equity markets to the rise in inflation, and by (inappropriate) extension, to central banks. Inflation led to the increase in nominal interest rates, so the argument goes, and thus the decline in the stock market price. Central banks are being blamed for not taking appropriate preventive action and underestimating the rise in inflation. However, our previous note showed that according to bond markets, the rise in inflation expectations (long-term, demand driven) has been relatively muted. In other words, while nominal interest rates rose, real (inflation-adjusted) rates, as measured by the 10-year TIPS yield, also rose, by a nearly equal amount. We also argued that much of the observed rise in inflation is likely to be linked to shorter-term supply related frictions, due to the pandemic and more recently, the war in Ukraine. In this case, monetary policies operated by central banks are of little help. In addition, historically, it is well known that equities act as a good hedge against long-term inflation.
So if not inflation, what drove stock prices down? To grapple with this issue, our models suggest going back to the fundamental principles of asset valuation. This principle states that the real (inflation-adjusted) equity share price reflects future expectations of real (inflation-adjusted) discounted dividends. Thus fluctuations in the share price, even in the short-term, reflect markets' perceptions of future changes in real dividend per share and real interest rates. In turn, according to our models, real dividend growth and real interest rates are driven by markets' perceptions of long-term real economic growth trend and uncertainty about the growth trend.

Let's examine these two principal factors (dividend per share and real interest rates) and their fundamental macro drivers in turn. Exhibit 2 portrays the evolution of the year-on-year change in dividend per share (dividends accruing to the S&P 500 index) and our model projections for US long-term real economic growth from January 2019 to present. According to the Exhibit, US equities real dividend growth has been on a continued and strengthened recovery path over the past year and since its fallout from the pandemic. Likewise, US long-term real economic growth implied by our models has also been steadily recovering, although still at lower rates compared to pre-pandemic rates and the pre-2008 GFC average rate of 2.8%. In the long run, real growth in the equity market dividend per share is primarily driven by real economic growth, according to our models. Thus, Exhibit 2 suggests that in the past year, long-term prospects for real dividend growth have not been deteriorating.
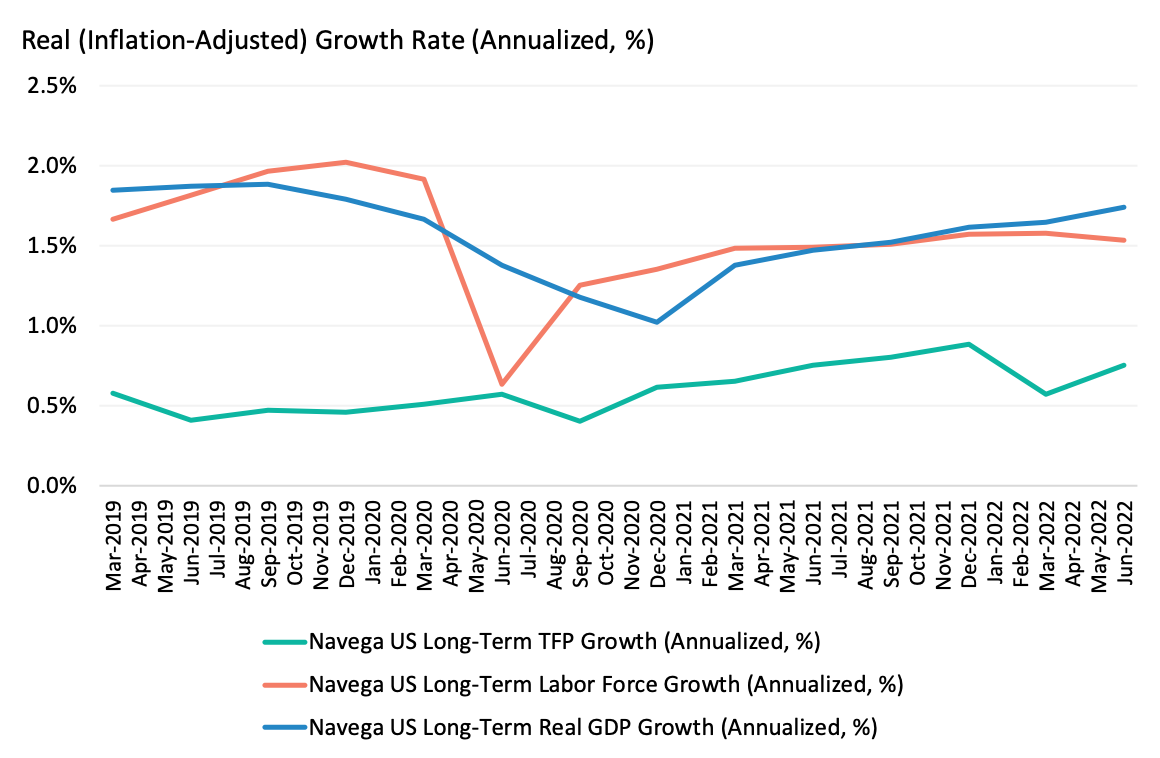
The next issue then, for investors, is to further understand the fundamental macro trends supporting our models' long-term real GDP growth projection (and by extension, long-term real dividend growth). Exhibit 3 depicts the recent evolution (since 2019) of the drivers of long-term real GDP growth in our models. These are the long-term (real) growth in the labor force and total factor productivity (TFP) . According to the Exhibit, labor force growth has been recovering on trend on a continuous basis since January 2021. While long-term TFP growth has remained sluggish, on average at about 0.8% (slightly above pre-pandemic trend but well below its 1.5% pre-2008 GFC average), there were no signs of relative deterioration.
Taken together, Exhibits 2 and 3 suggest that the decline in US equity markets is likely not due to expectations of lower long-term (nor short-term) dividend growth. The next step then, for investors, is to examine the possible changes in (real) discount rates. Exhibit 4 shows the evolution of 10-year TIPS yields - our measure of real discount rates. As discussed in our previous paper, the spectacular rise in equity market value from April 2020 through 2021 could be primarily attributed to the prevailing ultra low, negative real interest rates. After entering negative territory at the start of the pandemic, the 10-year TIPS yield bottomed at -100bps from August 2020 through December 2021. Since January 2022, real yields have been continuously and steeply increasing, averaging 50bps over the last month - a 150bps increase, YTD. Thus, given the stable prospects for long-term real dividend growth, it stands to reason that the dismal YTD performance of the US equity market has been primarily driven by the sheer increase in real yields.

Moreover, our macro-based models help understand the fundamental long-term drivers of this increase in real yields. According to our models, increases (declines) in real yields on trend are driven by the combination of increases (declines) in expectations of long-term growth and declines (increases) in growth uncertainty. The intuition is that investors demand insurance against shocks to real economic growth in the form of government bonds. Assuming no change in long-term growth prospects (according to Exhibits 2 and 3), Exhibit 4 shows that this increase in real yields is indeed consistent with markets' pricing of a decline in uncertainty about long-term real GDP growth, from its acutely high level induced by the pandemic. More precisely, our (monthly updated) macro uncertainty index decreased from 263 to 129, a nearly 50% decline. This decline in macro uncertainty (and the corresponding increase in real yields) is also consistent with the continuation of anaemic real GDP growth, driven by sluggish TFP growth and shy improvements in labor force growth, as portrayed by Exhibit 3.
In summary, inflation did not (most likely) lead the decline in stock market valuations. On the contrary, historically, equities have rather been an effective long-term inflation hedge. Nor should central banks be taking the blame. Going back to the fundamental principles of asset valuation, our models point to the rise in real interest rates as the likely driver. And in turn, the rise in real interest rates was primarily driven by a decline in uncertainty about a sluggish long-term real economic growth trend. Investors should avoid getting distracted by these misconstrued explanations read in most commentaries. Rather, our advice is to remain focused on the long-term, fundamental drivers of equity returns, and their exposures to macro risk. Going forward though, one key question remains whether there are any potential downside risks to future growth that are yet to be priced into (equity and bond) markets? We will explore this issue in a follow-up note.
This document is for informational purposes only. This document is intended exclusively for the person to whom it has been delivered, and may not be reproduced or redistributed to any other person without the prior written consent of Navega Strategies LLC (“Navega”). The information contained herein is based on Nageva’s proprietary research analytics of data obtained from third party statistical services, company reports or communications, publicly available information, or other sources, believed to be reliable. However, Navega has not verified this information, and we make no representations whatsoever as to its accuracy or completeness. Navega does not intend to provide investment advice through this document. This document is in no way an offer to sell or a solicitation of an offer to buy any securities. Investing in securities involves risk of loss, including a loss of principal, that clients should be prepared to bear. Past performance is not indicative of future results, which may vary materially. While this summary highlights important data, it does not purport to capture all dimensions of risk. The methodology used to aggregate and analyze data may be adjusted periodically. The results of previous analyses may differ as a result of those adjustments. Navega has made assumptions that it deems reasonable and used the best information available in producing any calculations herein. Statements that are nonfactual in nature, including opinions, projections and estimates, assume certain economic conditions and industry developments and constitute only current opinions that could be incorrect and are subject to change without notice. All information provided herein is as of the delivery date the document (unless otherwise specified) and is subject to modification, change or supplement in the sole discretion of Navega without notice to you. This information is neither complete nor exact and is provided solely as reference material with respect to the services offered by Navega. Information throughout this document, whether stock quotes, charts, articles, or any other statement or statements regarding market or other financial information, is obtained from sources which we and our suppliers believe reliable, but we do not warrant or guarantee the timeliness or accuracy of this information. The information presented here has not been personalized, and is not based on the financial circumstances of the recipient. This information may not be applicable to your particular financial needs, and should not, by itself, be used to make determinations regarding the purchase or sale of securities, or other investment decisions.
The model performance information presented is based on the application of Navega’s factor analysis, backtested against actual historical data. “Backtesting” is a process of objectively simulating historical performance information by applying a set of rules backward in time. The results of the application of Navega’s model do not reflect actual performance or actual historical data. Such models are prepared with the full benefit of hindsight, and it is not likely that similar results could be achieved in the future.
The model portfolios were constructed by Navega with the benefit of hindsight to illustrate certain performance metrics. The performance shown was not actually achieved by any investor. The investments in these hypothetical portfolios were selected with the full benefit of hindsight, after performance over the period shown was known. It is not likely that similar results could not be achieved in the future. The hypothetical portfolios presented here are purely illustrative, and representative only of a small sample of possible scenarios.
The projections shown do not represent actual performance, and are based on assumptions which may not occur. It is possible that the markets will perform better or worse than shown in the projections, the actual results of an investor who invests in the manner these projections suggest will be better or worse than the projections, and an investor may lose money by relying on these projections.