The Covid-19 pandemic has induced a dramatic increase in equity options skew – the market cost of insurance against downside risk. By contrast, short-term risk, as measured by VIX, is back to pre-pandemic lows. According to our models, this increase in options skew is consistent with an acute rise in macro uncertainty priced in ultra-low negative real bond yields. Real bond prices reflect the cost of insurance against negative, persistent shocks to real economic growth. Both recent trends in options skew and macro uncertainty are consistent with high equity market valuations. The takeaway for long-term investors is that our models suggest looking beyond equity valuations and short-term market risk (VIX), and focusing instead on alternative scenarios for real economic growth and their drivers – total factor productivity (TFP) growth and labor force growth.
Exhibit 1 depicts the evolution of the (rolling 30-day average) CBOE Skew and CBOE VIX since 2000. VIX is a common measure of short-term (1- to 3-month) equity market risk inferred from European out-of-the-money (OTM) option prices on the S&P 500 index with 30-day maturity. According to the Exhibit, a notable feature of VIX is its asymmetry: it tends to spike at the onset of financial and economic crises but recovers and decays more slowly following the event. For example, the VIX rose from about 20% to over 65% (on average) around the global financial crisis (GFC) from September 2008 to November 2008. It recovered to its pre-crisis level no earlier than January 2010. Likewise, the VIX rose swiftly from 20% to about 60% as Covid-19 spread globally in March 2020. It is now back to its rather low pre-pandemic level since June 2021.

As shown in the Exhibit, this asymmetry is also captured in equity options skew, which measures the market cost of insurance against downside risks. More precisely, this measure is based on observable differences between the price of OTM put options and comparable OTM call options with same expiry dates. The option skew increases when OTM put option prices exceeds comparable OTM call option prices, reflecting an increase in investors’ demand for protection against downside risks. In other words, downside risks, as priced by equity markets, outweigh upside risks. According to Exhibit 1, significant increases in option skew have tended historically to lead large market sell-offs and corresponding large outbursts in the VIX.
Interestingly, while short-term risk (VIX) declined back to its pre-pandemic lows in 2021, option skew seemed to have increased dramatically. At the same time, equity market valuations have continued their rise. As seen previously, according to our models, these high equity valuations have been largely driven by ultra-low real interest rates, which in turn reflect a combination of lower long-term real economic growth and an acute rise in long-term real growth uncertainty.
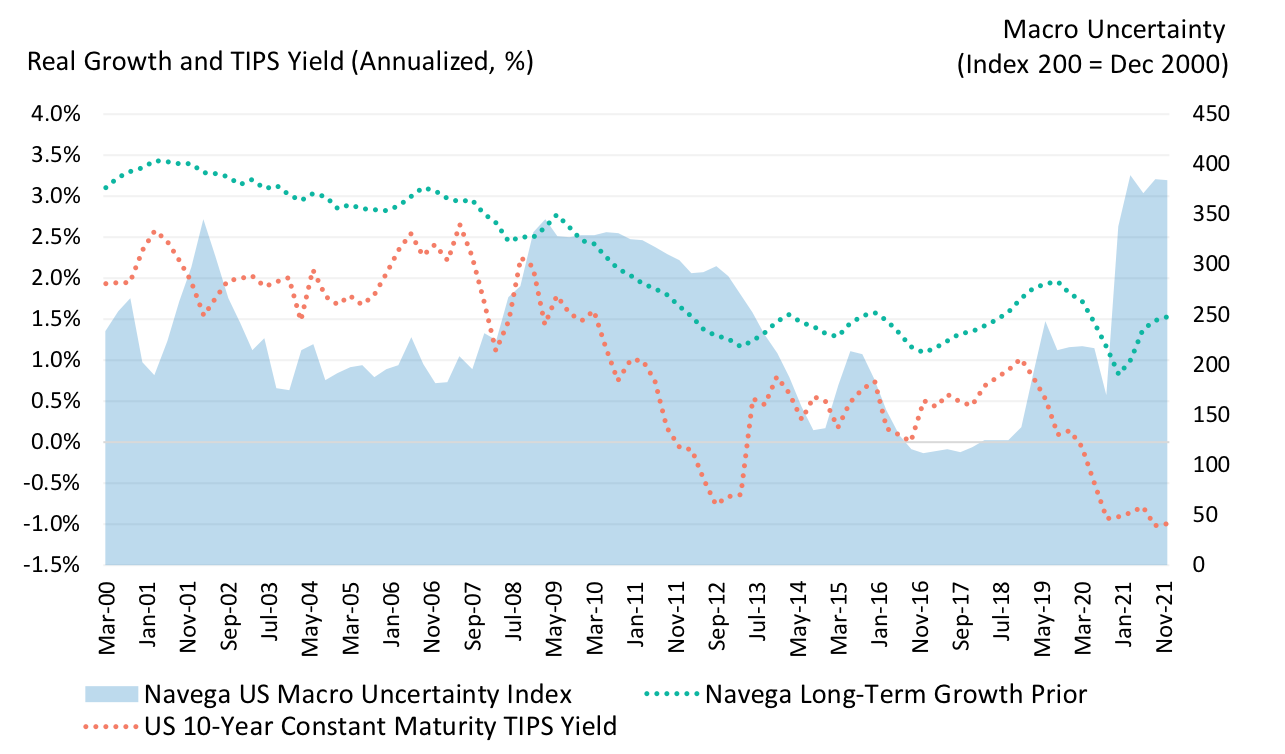
Could option skew also be pricing-in long-term growth uncertainty? Exhibit 2 and 3 suggests that there is indeed a close relationship between skew and macro uncertainty. Exhibit 2 portrays the evolution of the Navega US macro uncertainty index, a measure of long-term real GDP growth uncertainty, as priced in bond markets, together with the Navega prior for US long-term real GDP growth, and the US 10-year Constant Maturity TIPS yield. More precisely, macro uncertainty measures investors’ concern for the potential of pervasive, continued negative shocks to real economic growth. In other words, investors fear delayed economic recoveries compared to historical standards. Increases in macro uncertainty are consistent with declines in bond yields, as investors seek insurance against negative shocks to growth in the form of government bonds. This uncertainty is asymmetric – positive shocks to GDP growth (whether transitory or persistent) are valued favorably by investors – and is different than growth risk (as measured by quarter to quarter variability in growth rates).
Uncertainty rose sharply around the 2008 GFC, and persisted through 2015, decaying only slowly thereafter. The Covid-19 pandemic led to an even sharper rise in macro uncertainty, still persisting to this date, suggesting bond markets pricing of a slower than expected economic recovery. Consistently, real bond yields reached ultra-low and negative levels.

We note from Exhibit 1 and 2 that option skew and macro uncertainty have not always co-moved on a quarterly basis, with the exception of the pandemic. However, Exhibit 3 shows that, on trend, there is a closer relationship between the two measures. In particular, the pre-2008 GFC era was overall a period that experienced relatively benign levels of option skew and macro uncertainty. Post-2008, both skew and macro uncertainty have been higher than historical average. And both measures dramatically increased since the pandemic, reaching their highest observed levels.
What next? Going forward, our models suggest that long-term investors should look beyond equity valuations and market risk (VIX). They should focus on alternative recovery scenarios for real economic growth and their drivers – TFP growth and labor force growth – and trace their impact on cash-flows, returns and portfolio decisions. For example, slower recovery prospects could increase the potential for sharp equity market corrections. By contrast, higher growth, possibly driven by higher TFP growth (fueled by sustainable and resource efficient technological innovations) could well lead to further increases in equity returns and valuations.
This document is for informational purposes only. This document is intended exclusively for the person to whom it has been delivered, and may not be reproduced or redistributed to any other person without the prior written consent of Navega Strategies LLC (“Navega”). The information contained herein is based on Nageva’s proprietary research analytics of data obtained from third party statistical services, company reports or communications, publicly available information, or other sources, believed to be reliable. However, Navega has not verified this information, and we make no representations whatsoever as to its accuracy or completeness. Navega does not intend to provide investment advice through this document. This document is in no way an offer to sell or a solicitation of an offer to buy any securities. Investing in securities involves risk of loss, including a loss of principal, that clients should be prepared to bear. Past performance is not indicative of future results, which may vary materially. While this summary highlights important data, it does not purport to capture all dimensions of risk. The methodology used to aggregate and analyze data may be adjusted periodically. The results of previous analyses may differ as a result of those adjustments. Navega has made assumptions that it deems reasonable and used the best information available in producing any calculations herein. Statements that are nonfactual in nature, including opinions, projections and estimates, assume certain economic conditions and industry developments and constitute only current opinions that could be incorrect and are subject to change without notice. All information provided herein is as of the delivery date the document (unless otherwise specified) and is subject to modification, change or supplement in the sole discretion of Navega without notice to you. This information is neither complete nor exact and is provided solely as reference material with respect to the services offered by Navega. Information throughout this document, whether stock quotes, charts, articles, or any other statement or statements regarding market or other financial information, is obtained from sources which we and our suppliers believe reliable, but we do not warrant or guarantee the timeliness or accuracy of this information. The information presented here has not been personalized, and is not based on the financial circumstances of the recipient. This information may not be applicable to your particular financial needs, and should not, by itself, be used to make determinations regarding the purchase or sale of securities, or other investment decisions.
The model performance information presented is based on the application of Navega’s factor analysis, backtested against actual historical data. “Backtesting” is a process of objectively simulating historical performance information by applying a set of rules backward in time. The results of the application of Navega’s model do not reflect actual performance or actual historical data. Such models are prepared with the full benefit of hindsight, and it is not likely that similar results could be achieved in the future.
The model portfolios were constructed by Navega with the benefit of hindsight to illustrate certain performance metrics. The performance shown was not actually achieved by any investor. The investments in these hypothetical portfolios were selected with the full benefit of hindsight, after performance over the period shown was known. It is not likely that similar results could not be achieved in the future. The hypothetical portfolios presented here are purely illustrative, and representative only of a small sample of possible scenarios.
The projections shown do not represent actual performance, and are based on assumptions which may not occur. It is possible that the markets will perform better or worse than shown in the projections, the actual results of an investor who invests in the manner these projections suggest will be better or worse than the projections, and an investor may lose money by relying on these projections.