Analysts and pundits increasingly doubt monetary authorities' ability to harness inflation pressures without leading their economies into a recession. However, our models suggest that current macro fundamentals and market pricing are consistent with well-anchored long-term inflation expectations and a decline in global long-term growth uncertainty (i.e. increased certainty) about a slow, but improving global long-term real economic growth trend. In our view, pundits' cognitive dissonance relative to fundamentals and market pricing is driven by an obsession on the short-term effects of past monetary policies and old (pre-70s) economics theory. Instead, according to modern economic thinking and actual experience, it is the long-term expectation of real economic growth and the credibility of future policy path anchoring long-term inflation expectations that matter . This note addresses the first part of the issue: global growth expectations. A subsequent note will focus on the policy credibility and inflation expectations question.
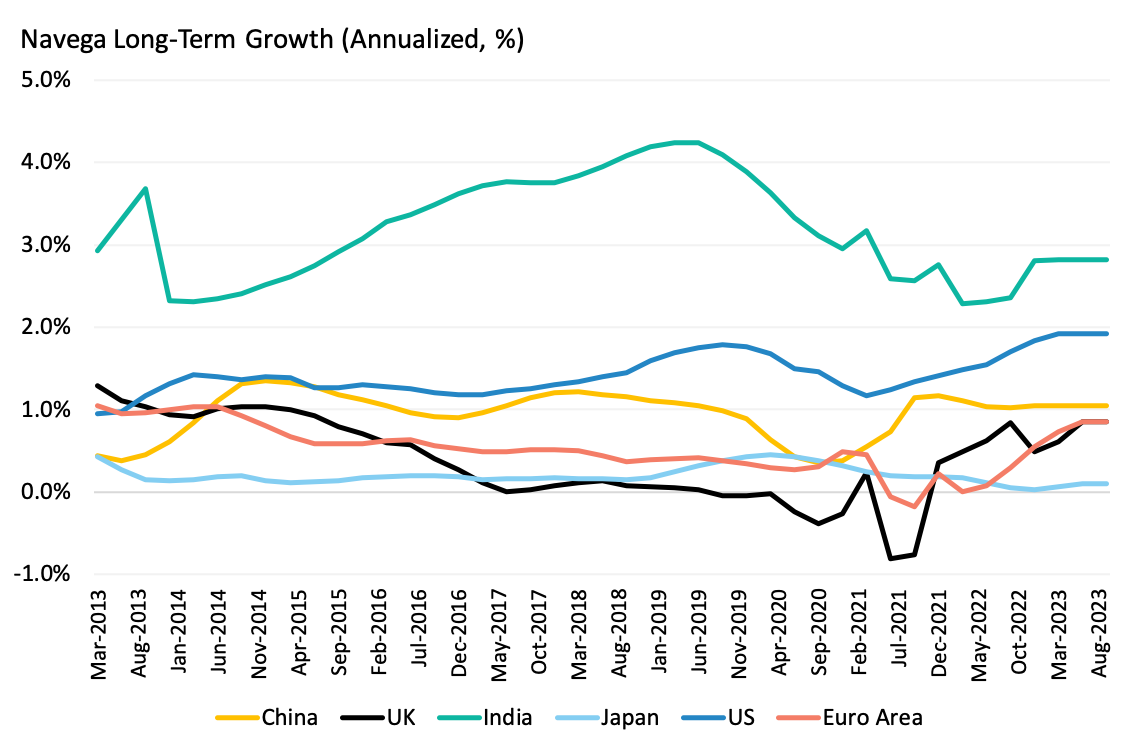
Exhibit 1 depicts the evolution of our model-implied long-term real economic growth expectation for the US, the Eurozone, Japan, UK, China and India since 2013. Overall, long-term growth expectations seem to have recovered to their pre-pandemic trend, and are improving, albeit at a rather slow pace. The US stands out as the growth engine of G7 countries, and given its economic size, is also the primary global growth engine. Real long-term growth expectations for India continue to remain strong, although significantly lower and on a declining trend compared to pre-pandemic trend . In the case of Japan, the main issue, which pre-dated the pandemic, is the continuation of near-zero long-term real economic growth.
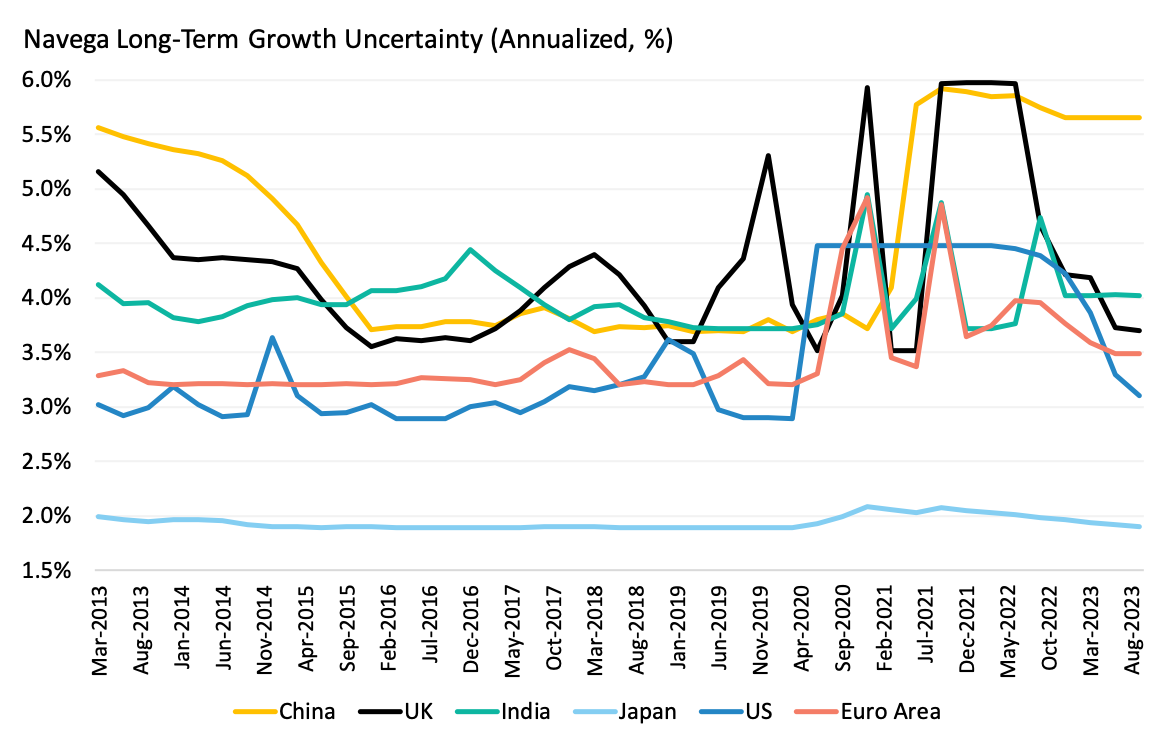
What about growth uncertainty? Interestingly, with the marked exception of China, markets' perception of long-term growth uncertainty has receded overall, as portrayed by Exhibit 2. In other words, there is an increasing certainty (overall) about improving, although slow long-term growth trends. However, the level and pace of decline in growth uncertainty varies, depending on the economy. While growth uncertainty in Japan and the US are now about or even below historical average, it is still above benign average levels in India, in the UK and the Eurozone.
The next question, then, is what drives these trends in long-term growth expectation and growth uncertainty? According to our models, these drivers are: total factor productivity (TFP) growth, labor force growth, and real (inflation-adjusted) government bond yields.
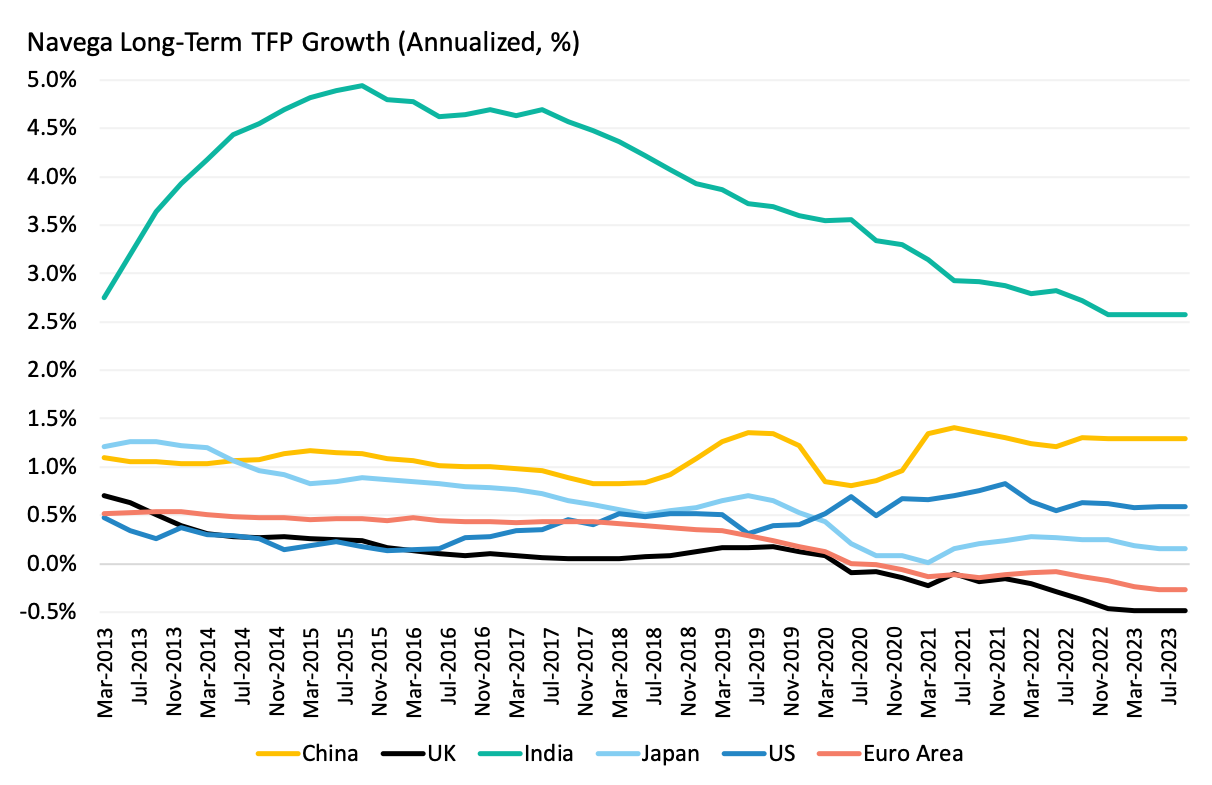
Let's examine these driving factors in sequence. Exhibit 3 shows the evolution of long-term TFP growth since 2013 for the same major economies, as implied by our models. According to the Exhibit, TFP growth trends vary markedly across economies. The US, India and China stand out as the only major economies with resilient TFP growth trends, although on a declining trend in the case of India since 2015 . As for Japan, the Eurozone and the UK, TFP growth failed to recover to pre-pandemic trend, with even continued declines into negative territory in the case of UK and the Euro area.
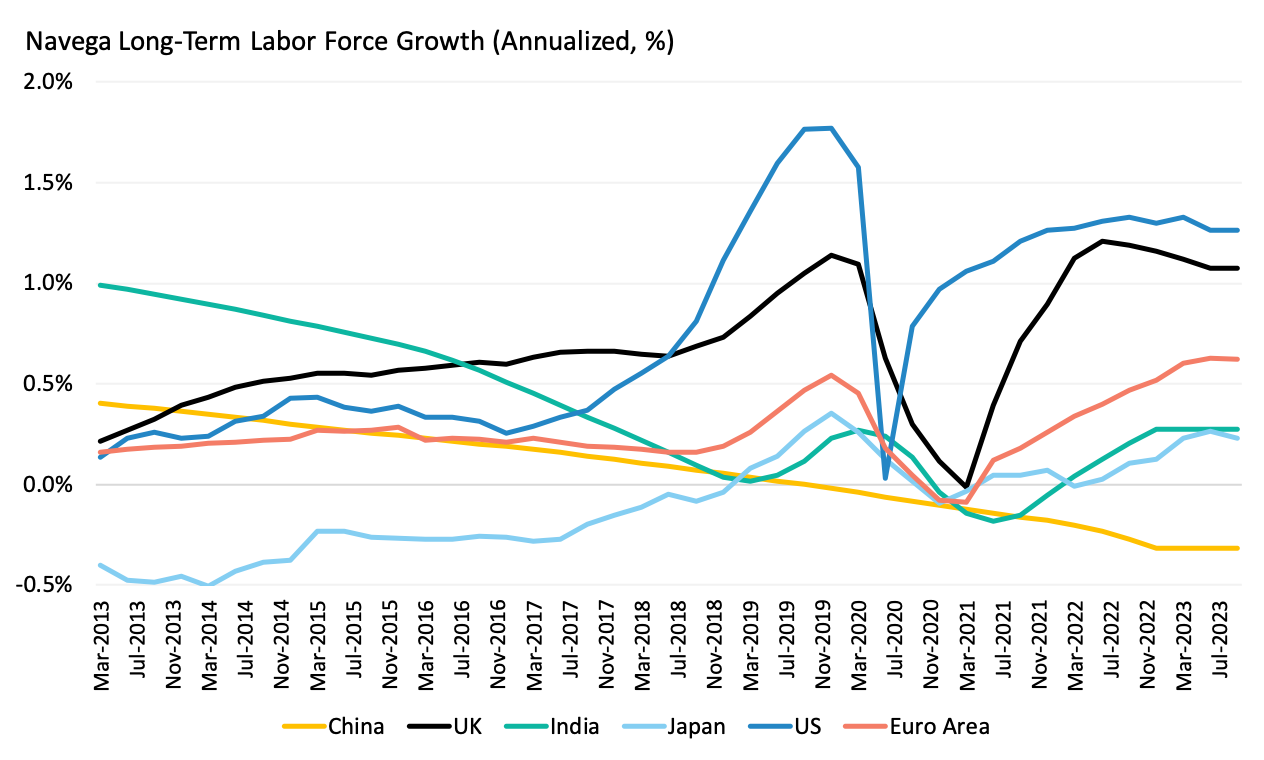
As for labor force growth, Exhibit 4 shows that after suffering heavily during the pandemic, it seems to have recovered to pre-pandemic average trend in all major economies, except China. The recovery has been particularly pronounced in the US, the Eurozone and the UK. However, going forward, this recovery in the labor force growth could be threatened in the case of the Eurozone and the UK due to the secular decline in working age population driven by population ageing.
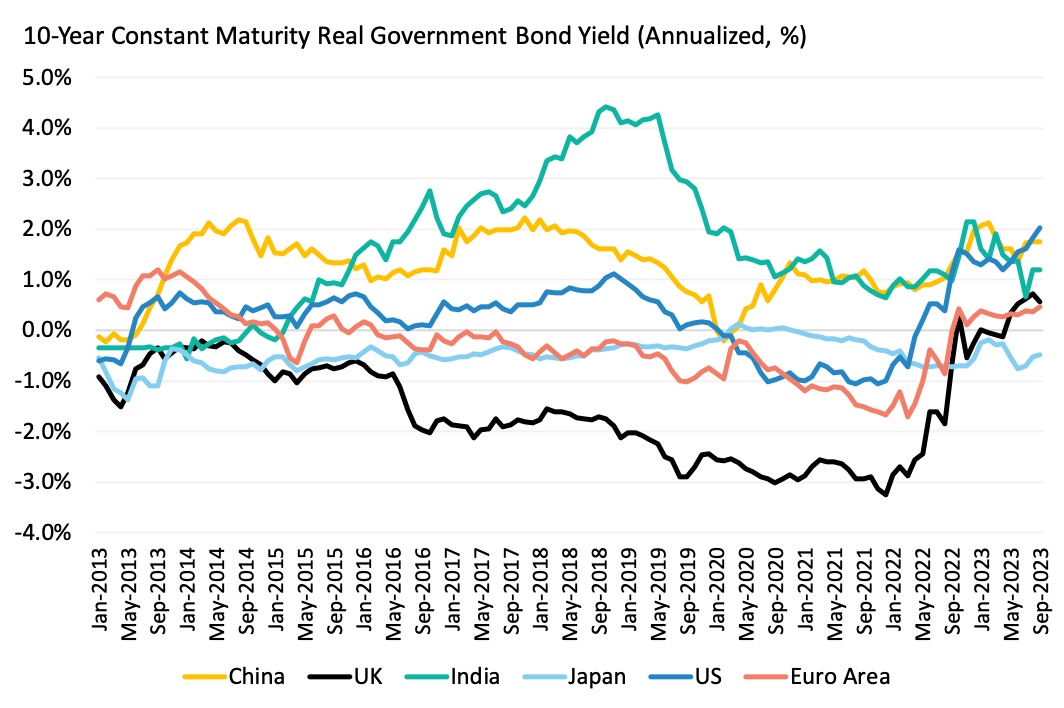
Finally, our third driver of long-term growth and growth uncertainty is the real yield. As depicted in Exhibit 5, the 10-year real government bond yield rose significantly in the past year in developed market economies, with the exception of Japan, reflecting improvements in long-term growth expectations and the decline in long-term growth uncertainty - real government bonds are perceived as insurance assets against shocks to real economic growth. India only experienced mild increases, while real yields declined in China.
Taken together, Exhibit 4, 5 and 6 suggest that the relative contributions to long-term growth expectations and uncertainty from TFP growth, labor force growth and real bond markets vary across economies. While primarily driven by TFP growth in the case of China and India, in the case of the US, UK and the Eurozone, the recovery has been consistent with the recovery in the labor force growth and the rise in real yields. As for long-term growth uncertainty, receding uncertainty in the US, UK, the Eurozone and India mainly reflected the rise in real yields. The persistent growth uncertainty prevailing in China, consistent with the relative decline in real yields, could be reflecting persistent declines in labor force growth as well as doubts about the rather sluggish recovery in TFP growth.
The key takeaway for investors is that a longer term focus on growth expectations and their drivers offers greater clarity on the effectiveness of monetary policies. Downside risks cannot be ruled out, including spillovers from a potential hard landing in China and the risk of continued declines in TFP growth (and in future labor force growth) in Europe. However, long-term macro fundamentals and recent trends in real bond yields are (overall) rather consistent, according to our models, with a decline in global growth uncertainty about slow, but improving global real growth. In turn, this growth trend reinforces the monetary authorities' credibility to bring down inflation without leading their economies into a recession. A complete perspective on the credibility of the future path of monetary (and fiscal) policy, though, requires a deeper understanding of long-term inflation expectations and their drivers. We address this issue in our subsequent note.
This document is for informational purposes only. This document is intended exclusively for the person to whom it has been delivered, and may not be reproduced or redistributed to any other person without the prior written consent of Navega Strategies LLC (“Navega”). The information contained herein is based on Nageva’s proprietary research analytics of data obtained from third party statistical services, company reports or communications, publicly available information, or other sources, believed to be reliable. However, Navega has not verified this information, and we make no representations whatsoever as to its accuracy or completeness. Navega does not intend to provide investment advice through this document. This document is in no way an offer to sell or a solicitation of an offer to buy any securities. Investing in securities involves risk of loss, including a loss of principal, that clients should be prepared to bear. Past performance is not indicative of future results, which may vary materially. While this summary highlights important data, it does not purport to capture all dimensions of risk. The methodology used to aggregate and analyze data may be adjusted periodically. The results of previous analyses may differ as a result of those adjustments. Navega has made assumptions that it deems reasonable and used the best information available in producing any calculations herein. Statements that are nonfactual in nature, including opinions, projections and estimates, assume certain economic conditions and industry developments and constitute only current opinions that could be incorrect and are subject to change without notice. All information provided herein is as of the delivery date the document (unless otherwise specified) and is subject to modification, change or supplement in the sole discretion of Navega without notice to you. This information is neither complete nor exact and is provided solely as reference material with respect to the services offered by Navega. Information throughout this document, whether stock quotes, charts, articles, or any other statement or statements regarding market or other financial information, is obtained from sources which we and our suppliers believe reliable, but we do not warrant or guarantee the timeliness or accuracy of this information. The information presented here has not been personalized, and is not based on the financial circumstances of the recipient. This information may not be applicable to your particular financial needs, and should not, by itself, be used to make determinations regarding the purchase or sale of securities, or other investment decisions.
The model performance information presented is based on the application of Navega’s factor analysis, backtested against actual historical data. “Backtesting” is a process of objectively simulating historical performance information by applying a set of rules backward in time. The results of the application of Navega’s model do not reflect actual performance or actual historical data. Such models are prepared with the full benefit of hindsight, and it is not likely that similar results could be achieved in the future.
The model portfolios were constructed by Navega with the benefit of hindsight to illustrate certain performance metrics. The performance shown was not actually achieved by any investor. The investments in these hypothetical portfolios were selected with the full benefit of hindsight, after performance over the period shown was known. It is not likely that similar results could not be achieved in the future. The hypothetical portfolios presented here are purely illustrative, and representative only of a small sample of possible scenarios.
The projections shown do not represent actual performance, and are based on assumptions which may not occur. It is possible that the markets will perform better or worse than shown in the projections, the actual results of an investor who invests in the manner these projections suggest will be better or worse than the projections, and an investor may lose money by relying on these projections.