The US CPI rose 3.7% in August from previous year, according to the latest release. Up from 3.2% in July, some analysts and investors continue to fuel doubts about the credibility of monetary policy. However, these doubts are misconstrued in our view, as they excessively focus on realized inflation rates and short-term effects of past policies. They also ignore fiscal considerations. Instead, our models suggest that it is the expected, longer term path of fiscal and monetary policies, and their anchoring effect on long-term inflation expectations that matter. According to our models, government finances and bond markets pricing are consistent with a decline in long-term inflation uncertainty about benign long-term inflation expectations of about 2.1% - barely above the Fed's long-term target rate of 2%.
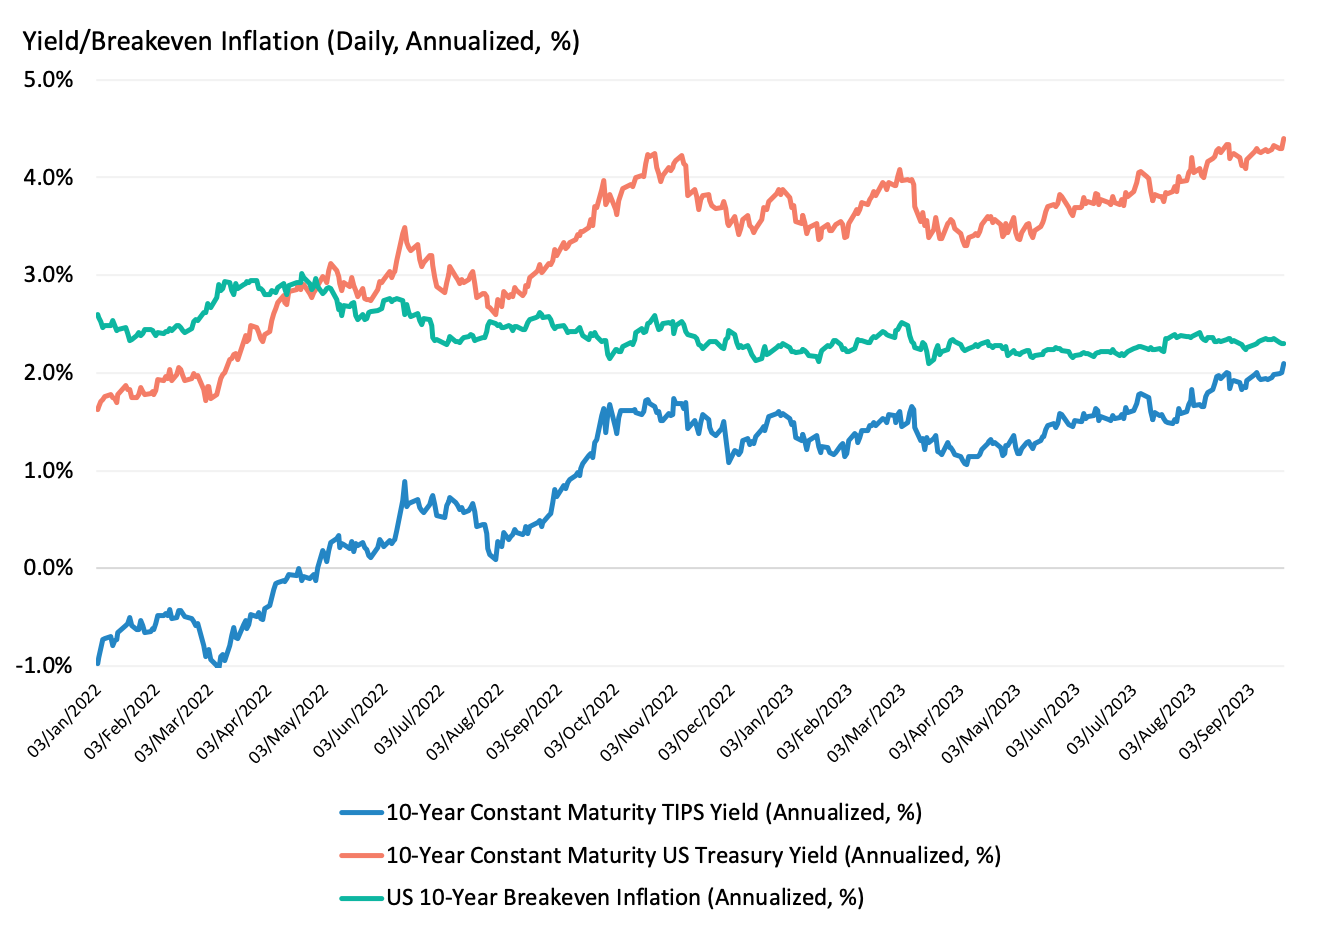
Our starting point to gauge inflation expectations is bond market pricing. Exhibit 1 shows the evolution from January 3rd, 2022 to September 20th, 2023 of the US 10-Year Constant Maturity Treasury yield and the US 10-Year Constant Maturity TIPS yield, along with their difference, the 10-Year breakeven inflation rate. According to the Exhibit, the 10-year Treasury yield increased 60bps since the start of the year, from 3.8% to 4.4%. Interestingly, the 10-year TIPS yield also increased 60bps, from 1.5% to 2.1%. As discussed in our previous note, this increase in real yields was primarily driven by a decline in real economic growth uncertainty about slow but improving long-term growth expectations. Taken together, the 10-year breakeven inflation remained barely unchanged at about 2.3%, down from its March 2022 peak level of 3%. Bond markets also shrugged off the news of the realized increase in inflation in August. Thus, according to bond market pricing, future monetary and fiscal policies seem credible.
The question, then, is why would the bond market judge monetary and fiscal policies to be credible? In our view, according to the Fed's chairman statements, the central bank is committed to bring down inflation back to its target rate of 2%. Indeed, the Fed has already raised interest rates significantly from nearly 0% in February, 2022 to 5.3% in July, 2023 - a total of 11 hikes in 14 months. It has also strongly signaled its intention to continue to do so, following its monitoring of inflation data, and the evolution of the macro and markets environment.
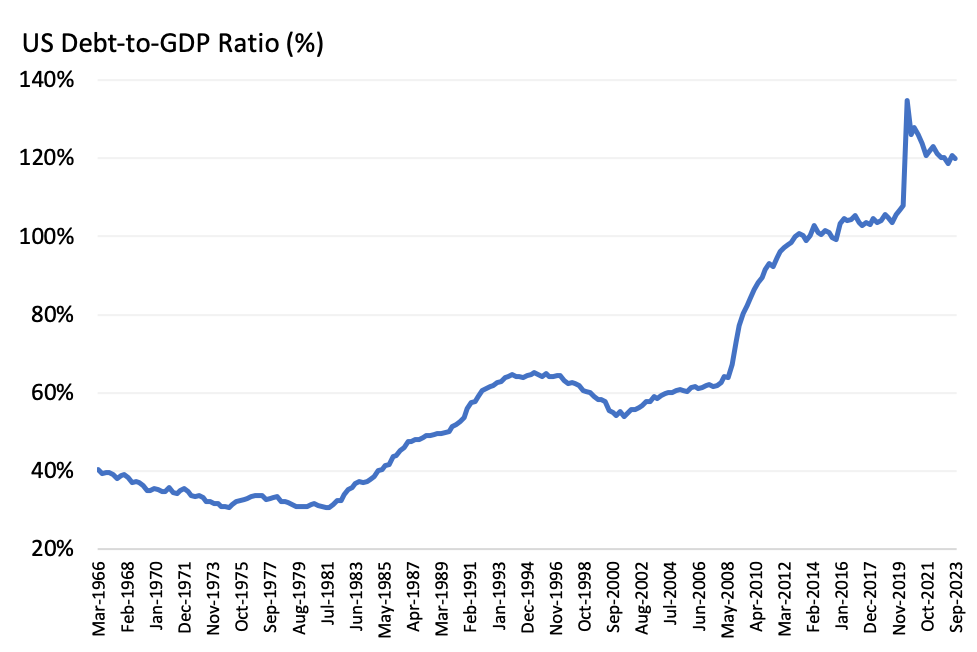
Moreover, these statements seem well backed by the government budget constraint. As shown in Exhibit 2, the US debt-to-gdp ratio declined from its pandemic induced peak level of 135% in June 2020 to 120% in September 2022. Since then, it has remained stable. And further expansion of (unbacked) deficit financing strikes us as politically unlikely. These government finances considerations link expected inflation levels to the expected levels of net government debt creation (including growth in the monetary base and fiscal surpluses, primarily revenues from taxes). All else equal, higher expected levels of government debt creation over time relative to expectations of future surpluses lead to higher levels of expected inflation today. What matters is the expected path of debt creation and whether it can be backed by potential future surpluses (i.e. future real economic growth), not single episodic bursts of new debt. In turn this question is closely tied to the path for real growth and real growth uncertainty.
In this context, greater certainty about slow but improving long-term growth prospects, as shown in our previous note, lends support to monetary and fiscal credibility. Said differently, these growth trends also imply greater certainty (i.e. receding uncertainty) about benign and declining inflation expectations evolving closer to the Fed's target rate.
In the case of the US, another supporting factor is the privileged status of USD denominated debt as safe-haven assets of the world. This safe-haven status has meant that USD-denominated debt has been held by both US and non-US investors. One of the many reasons that non-US investors would hold US dollar denominated debt assets is because of their perceived safety, especially in bad economic times. In turn, this perception of safety is anchored on the perception of the economic position of the US in the world: US real growth rates are expected to be higher than non-US real growth rates. So, for the US, inflation uncertainty (and hence, perception of policy credibility) also depends on changes in expected real growth and real growth uncertainty relative to the rest of the world.
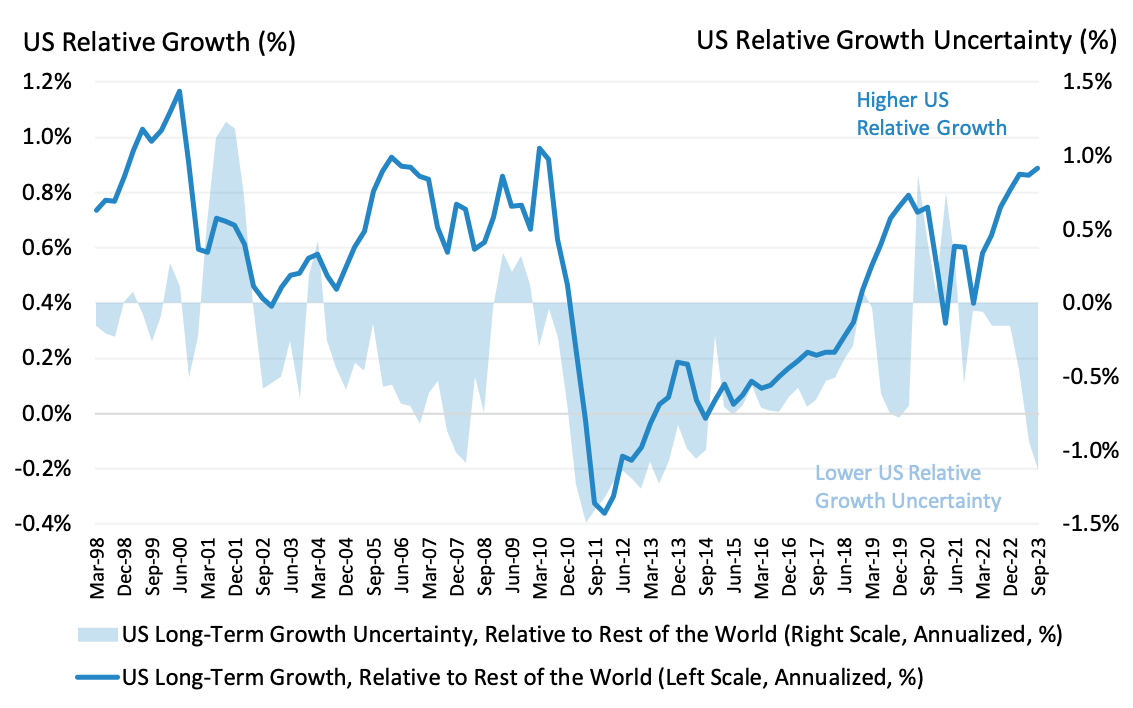
So what’s been happening with real growth and real growth uncertainty in the US, relative to the rest of the world? Exhibit 3 plots since 1997, the evolution of our real growth prior for the US versus the rest of the world, and the evolution of the US relative growth uncertainty. As is evident from the exhibit, real growth in the US is expected to exceed real growth in the rest of the world, with a growth differential comparable to pre-pandemic and pre-2008 levels. At the same time, US relative growth uncertainty has declined. Consequently, these trends contribute to reinforcing the US net external debt position and to the decline of US inflation uncertainty.
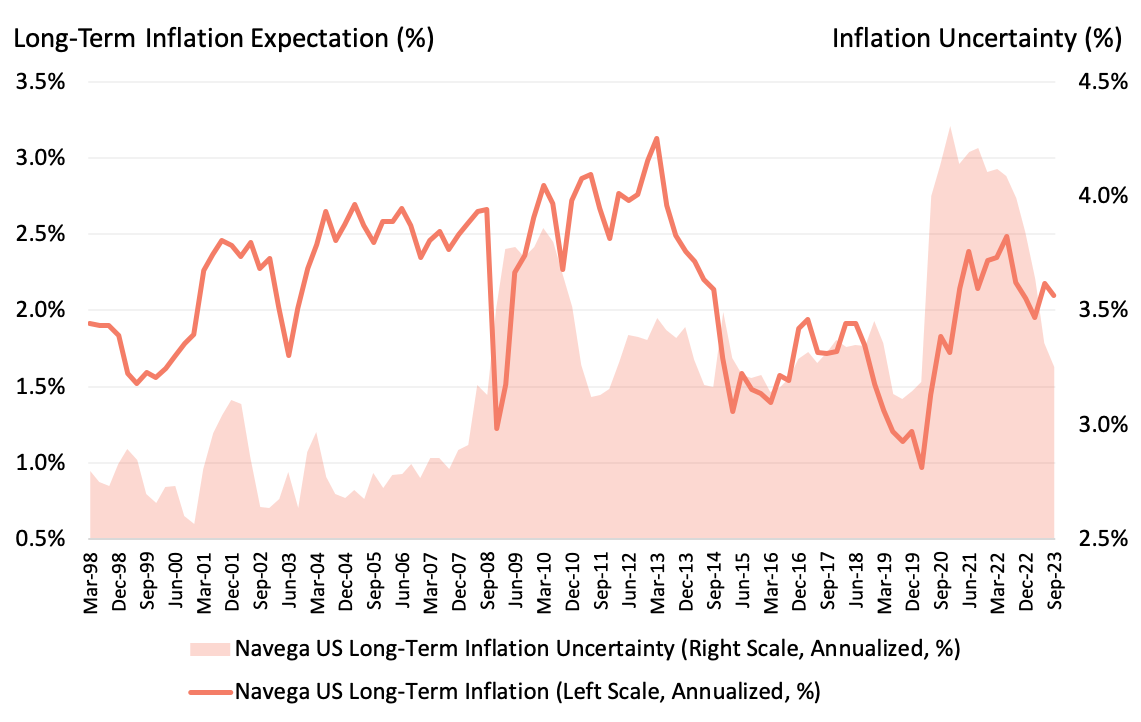
Taken together, Exhibits 1, 2 and 3 lend support to the credibility of US fiscal and monetary policies, and in turn, to our models' expectations of long-term inflation and inflation uncertainty. As portrayed in Exhibit 4, according to our models and since the start of the year, long-term inflation uncertainty has been receding about benign long-term inflation expectations of 2.1%. Inflation uncertainty is now back to the pre-pandemic levels, although it still remains higher compared to the pre-2008 GFC era. These trends have been driven by both the decline in long-term growth uncertainty - in absolute terms and relative to the rest of the world - and solid improvements in long-term US real growth expectations relative to the rest of the world.
That said, markets' perception of policy credibility does not necessarily imply a smooth transition of realized inflation rates toward the Fed's target rate. Indeed, this path remains subject to the normalisation of energy prices, supply frictions, and fluctuations in the global macro and markets environment. However, the takeaway for investors is that there are opportunities in the resolution of these frictions. For example, real economic growth and growth uncertainty trends across countries have become fragmented since the pandemic. According to our models, these spreads in real growth trends, should they persist, imply further differentiation in expected inflation rates and expected asset returns across countries. We will continue to explore these trends and their investment implications in our next note.
This document is for informational purposes only. This document is intended exclusively for the person to whom it has been delivered, and may not be reproduced or redistributed to any other person without the prior written consent of Navega Strategies LLC (“Navega”). The information contained herein is based on Nageva’s proprietary research analytics of data obtained from third party statistical services, company reports or communications, publicly available information, or other sources, believed to be reliable. However, Navega has not verified this information, and we make no representations whatsoever as to its accuracy or completeness. Navega does not intend to provide investment advice through this document. This document is in no way an offer to sell or a solicitation of an offer to buy any securities. Investing in securities involves risk of loss, including a loss of principal, that clients should be prepared to bear. Past performance is not indicative of future results, which may vary materially. While this summary highlights important data, it does not purport to capture all dimensions of risk. The methodology used to aggregate and analyze data may be adjusted periodically. The results of previous analyses may differ as a result of those adjustments. Navega has made assumptions that it deems reasonable and used the best information available in producing any calculations herein. Statements that are nonfactual in nature, including opinions, projections and estimates, assume certain economic conditions and industry developments and constitute only current opinions that could be incorrect and are subject to change without notice. All information provided herein is as of the delivery date the document (unless otherwise specified) and is subject to modification, change or supplement in the sole discretion of Navega without notice to you. This information is neither complete nor exact and is provided solely as reference material with respect to the services offered by Navega. Information throughout this document, whether stock quotes, charts, articles, or any other statement or statements regarding market or other financial information, is obtained from sources which we and our suppliers believe reliable, but we do not warrant or guarantee the timeliness or accuracy of this information. The information presented here has not been personalized, and is not based on the financial circumstances of the recipient. This information may not be applicable to your particular financial needs, and should not, by itself, be used to make determinations regarding the purchase or sale of securities, or other investment decisions.
The model performance information presented is based on the application of Navega’s factor analysis, backtested against actual historical data. “Backtesting” is a process of objectively simulating historical performance information by applying a set of rules backward in time. The results of the application of Navega’s model do not reflect actual performance or actual historical data. Such models are prepared with the full benefit of hindsight, and it is not likely that similar results could be achieved in the future.
The model portfolios were constructed by Navega with the benefit of hindsight to illustrate certain performance metrics. The performance shown was not actually achieved by any investor. The investments in these hypothetical portfolios were selected with the full benefit of hindsight, after performance over the period shown was known. It is not likely that similar results could not be achieved in the future. The hypothetical portfolios presented here are purely illustrative, and representative only of a small sample of possible scenarios.
The projections shown do not represent actual performance, and are based on assumptions which may not occur. It is possible that the markets will perform better or worse than shown in the projections, the actual results of an investor who invests in the manner these projections suggest will be better or worse than the projections, and an investor may lose money by relying on these projections.