US real GDP grew at the solid pace of 2.4% (annualized) over Q2. Despite being above expectations, some analysts and investors remain concerned about the possibility of a "hard landing" of the US economy with severe equity market corrections, as (obsessive) doubts persist about the effectiveness of the Federal Reserve's monetary tightening policies. However, in our view, this excessive focus on past policy (short-term) effects on the economy and markets is misplaced. Our models indicate that it is the uncertainty about the future path that matters for long-term real economic growth and inflation, and in turn, portfolio returns and strategies. In this context, investors are better advised to analyse the sources of long-term growth and inflation uncertainty, envision alternative macro scenarios, and trace their impact on portfolio returns in a systematic fashion. According to our models, the current environment only implies a 16% probability for a "hard landing" scenario (of lower growth and higher uncertainty), down from 20% at the start of the year. In fact, macro fundamentals and markets pricing rather point to a "soft landing", characterized by a decline in uncertainty about a slower long-term real GDP growth of about 1.9%.

The starting point for our models and our analysis is the baseline scenario. Exhibit 1 portrays, since 2007, the monthly and timely evolution of US long-term real GDP growth expectations and growth uncertainty - the primary drivers of long-term returns - implied by both fundamentals and bond markets. According to the Exhibit, long-term real growth expectations have been improving slowly, although steadily, over the past year, reaching 1.9% through August . This trend growth is above the pre-pandemic trend of 1.7%, but still 100bps below the pre-2008 global financial crisis trend. Perhaps the more interesting observation is that long-term growth uncertainty has steeply declined. Over the past year, our macro uncertainty index decreased from 239 to the near pre-pandemic and pre-2008 GFC levels of 113.
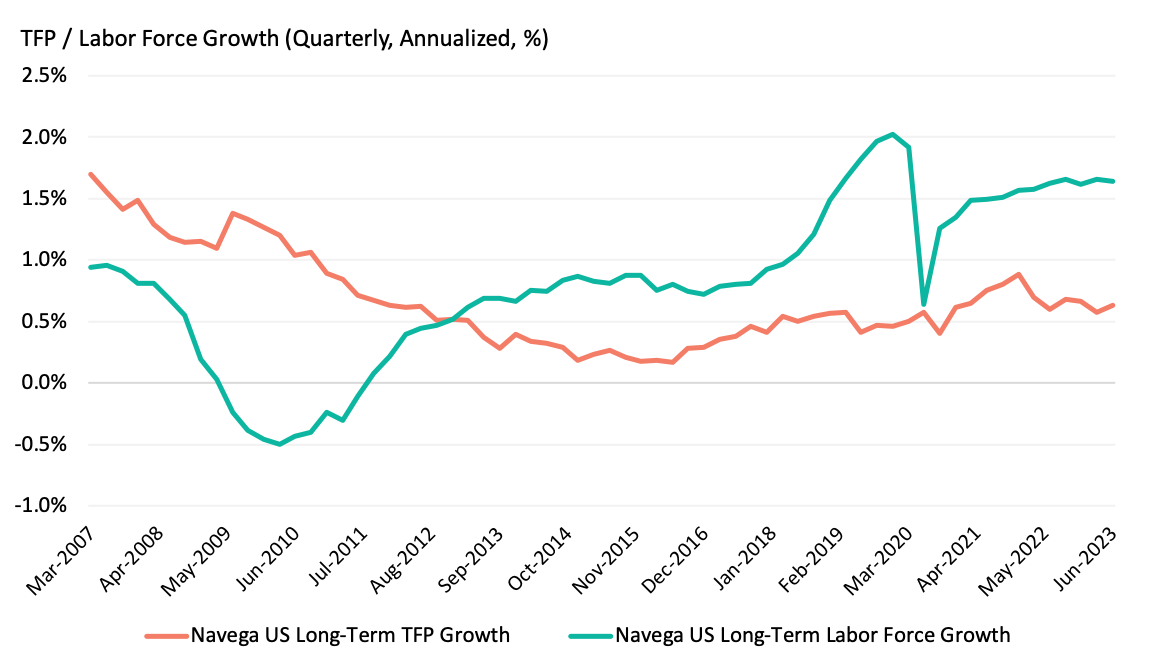
What are the sources of this declining uncertainty about slower long-term growth expectations? According to our models, long-term growth expectations and growth uncertainty are primarily driven by long-term total factor productivity (TFP) growth , labor force growth, and real (inflation-linked) government bond yields. Exhibit 2 shows that while long-term TFP growth stagnated over the past year, (although above the pre-pandemic decade (2010-2019) average), labor force growth experienced robust improvements over the past year, reaching almost pre-pandemic levels .
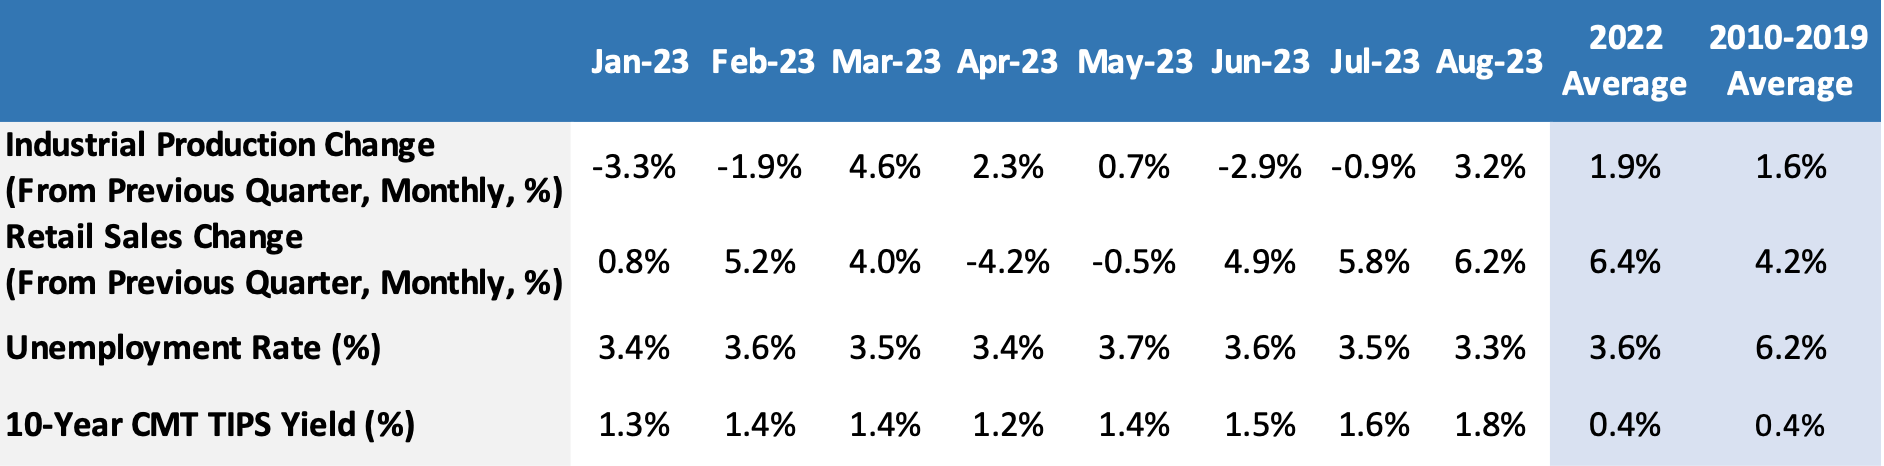
The strong decline in uncertainty and improvements in long-term growth expectations are also reflected in the steady increase in real government bond yields. Indeed, real bonds are perceived by investors as insurance assets against negative shocks to real growth . According to Exhibit 3, the US 10-year Constant Maturity (CMT) TIPS yield increased 53bps year-to-date, from 129bps to 182bps. The current real yield level is about 140bps higher than the 2022 and pre-pandemic decade average .
Exhibit 3 also shows the recent evolution of selected short-term macro indicators. These indicators are sourced as they are being released, even within the month, in a timely fashion. This helps our models "nowcast" the indicators themselves, as well as other fundamental macro indicators that are often released with a lag (including GDP itself). In turn, these nowcasts are incorporated into our estimates of long-term TFP growth and labor force growth, thereby improving the timeliness and accuracy of our model expectations of long-term growth and growth uncertainty.
The principle conclusion from the Exhibit is that both supply and demand indicators are consistent with continued improvements in the US real economy albeit at a slow pace. On the supply side, quarterly (annualized) changes in industrial production averaged 0.2% since the start of the year. By contrast, the 2022 average rate was 1.9% and the pre-pandemic decade average was 1.6%. On the demand side, changes in retail sales fared better, especially in the last three months. However the YTD average of 2.4% is still below the 2022 average of 6.4% and the pre-pandemic decade average of 4.2%. Labor markets have remained strong, with a rate of unemployment hovering around 3.5%, a significantly lower rate compared to the 2010-2019 average.

Taken together, Exhibits 2 and 3 point support our model baseline scenario of a "soft landing", driven by lower uncertainty around a slow long-term growth trend. That said, going forward, alternative plausible scenarios including "hard landing" cannot be ruled out. Exhibit 4 considers four scenarios of growth and growth uncertainty, and their market-implied probability. According to our models, the current environment implies a 16% probability for a "hard landing" scenario (down from 20% at the start of the year) which we frame as a repeat of the 2008 GFC (lower growth and higher uncertainty).
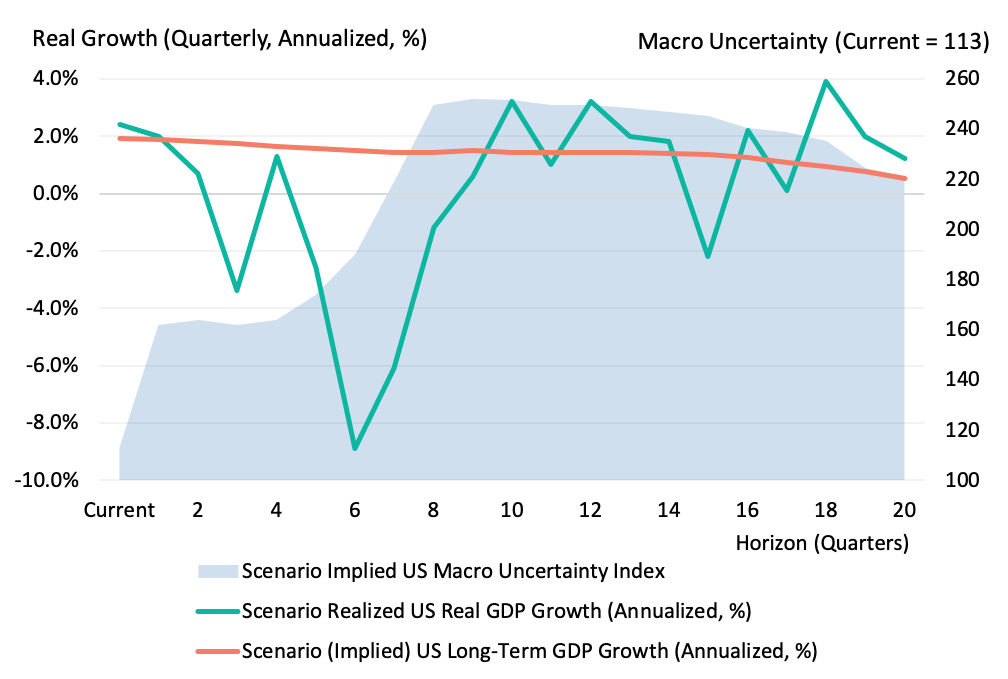
How to evaluate a forward-looking hard landing scenario? Empirical evidence from the 2008 GFC suggest that "hard landing" is consistent with shorter term indicators such as industrial production and retail sales experiencing continued, sizeable declines over the next 9 to 12 months . In turn, as illustrated in Exhibit 5, such scenario could lead to a -20% fall in real GDP over the subsequent year, before recovering over the following 3 years, albeit around a lower long-term trend of about 50bps. At the same time, our macro uncertainty index would more than double, from 113 to about 250, and remain persistently high.

What is the impact on realized returns? As shown in Exhibit 6 and according to our models, a balanced 65/35 cap-weighted equity/bond portfolio would experience a cumulative peak-to-trough decline of about -18%, followed by a lengthy recovery until uncertainty resolves about improved real economic growth outcomes. Portfolios could also vary in their sensitivity to growth and growth uncertainty shocks, depending on their allocations. A growth-sensitive portfolio fully allocated to equities and tilted toward small cap and value stocks could experience more severe drawdowns of -33% (peak-to-trough). By contrast, a 50/50 equity/bond growth-defensive portfolio tilted toward quality stocks could limit drawdowns at -13% (peak-to-trough).
Our analysis carries important takeaways for investors:
It is the potential for large changes to long-term growth expectations and uncertainty that matters for long-term investment returns and risk.
Persistent changes to shorter-term macro and market indicators could help signal changes to longer-term growth expectations and uncertainty.
Our framework and models help investors design alternative scenarios of growth and growth uncertainty, and trace their impact on portfolio returns and allocations in a consistent, systematic fashion.
While this note focused on growth expectations and uncertainty, we left out the issue of inflation prospects, another source of concern for investors in the current macro and markets environment. Our next note will address the question of short and longer term inflation expectations.
This document is for informational purposes only. This document is intended exclusively for the person to whom it has been delivered, and may not be reproduced or redistributed to any other person without the prior written consent of Navega Strategies LLC (“Navega”). The information contained herein is based on Nageva’s proprietary research analytics of data obtained from third party statistical services, company reports or communications, publicly available information, or other sources, believed to be reliable. However, Navega has not verified this information, and we make no representations whatsoever as to its accuracy or completeness. Navega does not intend to provide investment advice through this document. This document is in no way an offer to sell or a solicitation of an offer to buy any securities. Investing in securities involves risk of loss, including a loss of principal, that clients should be prepared to bear. Past performance is not indicative of future results, which may vary materially. While this summary highlights important data, it does not purport to capture all dimensions of risk. The methodology used to aggregate and analyze data may be adjusted periodically. The results of previous analyses may differ as a result of those adjustments. Navega has made assumptions that it deems reasonable and used the best information available in producing any calculations herein. Statements that are nonfactual in nature, including opinions, projections and estimates, assume certain economic conditions and industry developments and constitute only current opinions that could be incorrect and are subject to change without notice. All information provided herein is as of the delivery date the document (unless otherwise specified) and is subject to modification, change or supplement in the sole discretion of Navega without notice to you. This information is neither complete nor exact and is provided solely as reference material with respect to the services offered by Navega. Information throughout this document, whether stock quotes, charts, articles, or any other statement or statements regarding market or other financial information, is obtained from sources which we and our suppliers believe reliable, but we do not warrant or guarantee the timeliness or accuracy of this information. The information presented here has not been personalized, and is not based on the financial circumstances of the recipient. This information may not be applicable to your particular financial needs, and should not, by itself, be used to make determinations regarding the purchase or sale of securities, or other investment decisions.
The model performance information presented is based on the application of Navega’s factor analysis, backtested against actual historical data. “Backtesting” is a process of objectively simulating historical performance information by applying a set of rules backward in time. The results of the application of Navega’s model do not reflect actual performance or actual historical data. Such models are prepared with the full benefit of hindsight, and it is not likely that similar results could be achieved in the future.
The model portfolios were constructed by Navega with the benefit of hindsight to illustrate certain performance metrics. The performance shown was not actually achieved by any investor. The investments in these hypothetical portfolios were selected with the full benefit of hindsight, after performance over the period shown was known. It is not likely that similar results could not be achieved in the future. The hypothetical portfolios presented here are purely illustrative, and representative only of a small sample of possible scenarios.
The projections shown do not represent actual performance, and are based on assumptions which may not occur. It is possible that the markets will perform better or worse than shown in the projections, the actual results of an investor who invests in the manner these projections suggest will be better or worse than the projections, and an investor may lose money by relying on these projections.