US 10-Year (CMT) Treasury yields have been declining (on trend) since November 1st. Pundits' recent call for high interest rates for longer appears disconnected with the reality of market pricing and macroeconomic fundamentals. These calls implicitly assume the continuation of improvements in future real economic growth prospects will lead to persistently high inflation. While plausible, this scenario for growth and inflation seems unlikely, according to our models, principally because it ignores the impact of growth uncertainty. By contrast, in our models' most likely scenario, increased certainty about slow long-term growth and benign long-term inflation expectations imply lower interest rates ... for longer.
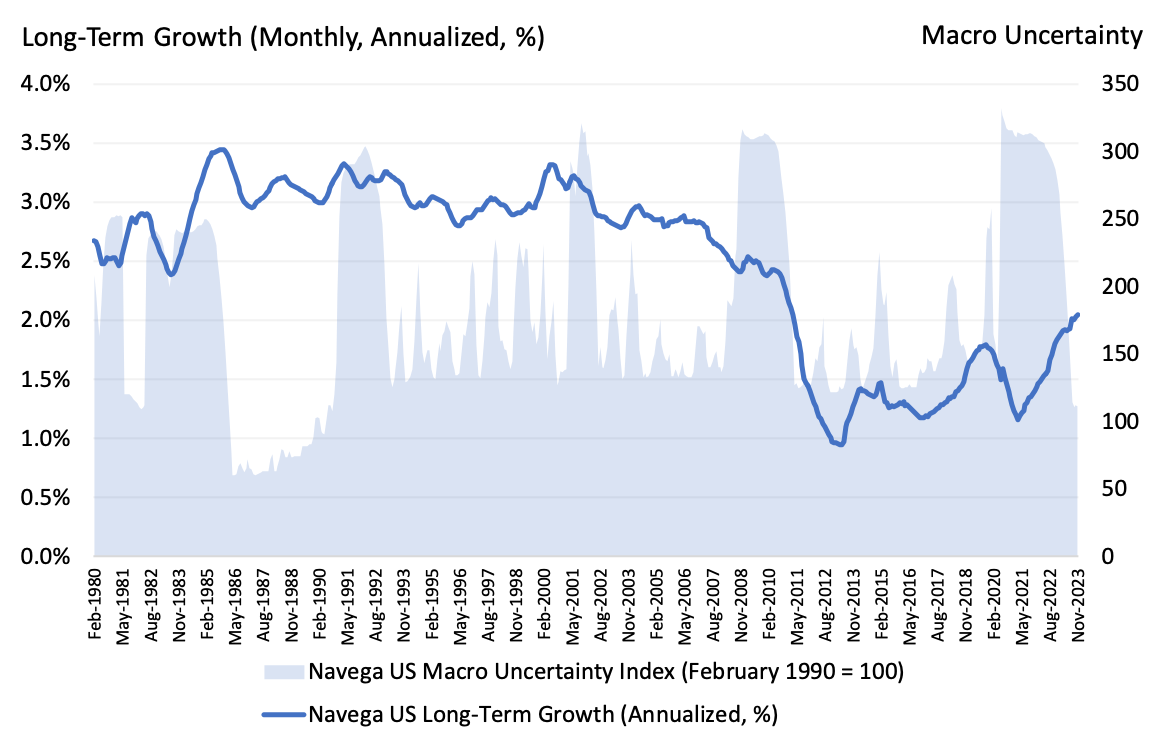
We start our analysis by examining the long-term drivers of real (TIPS) yields. According to our models, these drivers are the long-term real economic growth expectations and long-term growth uncertainty. As portrayed by Exhibit 1, and as discussed in our previous note, in the US, markets and macro fundamentals point to more certainty (i.e. receding uncertainty) about improved but still slow long-term real growth. While growth expectations have recovered (to about 2%) since the pandemic lows, they remain significantly lower compared to the pre-2008 Global Financial Crisis (GFC) average trend of about 3%. It is worth noting that our macro uncertainty index - a measure of long-term growth uncertainty - has now declined to 111, a level below the pre-GFC average of about 170. Going forward, the most likely scenario , according to our models, is that of a continuation of low long-term real growth and a moderate increase in uncertainty back to its (benign) pre-GFC average level. The question is how long it will take for this reversion of uncertainty to materialize.
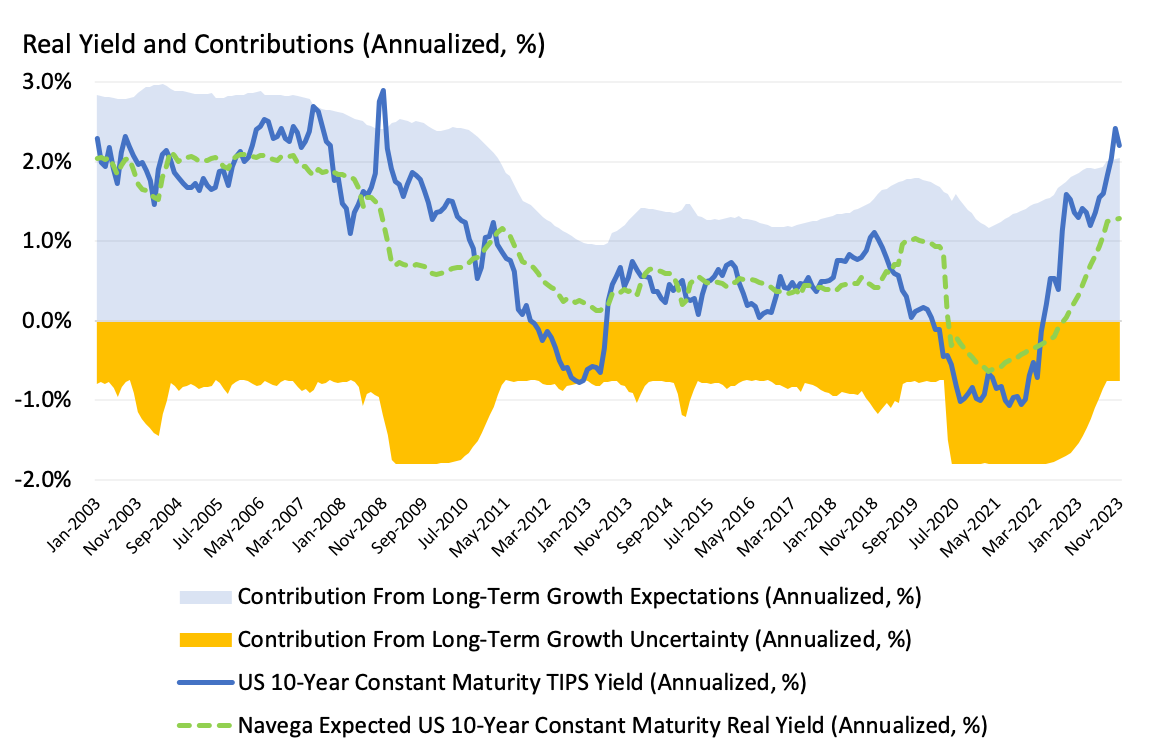
In turn, our models indicate that these real economic growth and growth uncertainty trends have implications for real (inflation-linked) bond yields. Exhibit 2 depicts the evolution since 2003 of the 10-Year Constant Maturity TIPS yield, along with its long-term expectations, and contributions from long-term growth expectations and growth uncertainty, as implied by our models. As shown in the Exhibit, long-term growth expectations contribute positively to real government bond yields, while growth uncertainty contributes negatively. Indeed, investors view real government bonds as safe, insurance assets against negative shocks to real economic growth. The sheer decline in real yields during the pandemic was driven by the sizeable decline in real growth expectations and a corresponding increase in growth uncertainty. Conversely, the rise in real yields in the past two years was driven by the continued recovery in real growth expectations and the decline in uncertainty.
What about nominal yields? According to our models, nominal yields are driven by expectations of long-term real growth, growth uncertainty and long-term inflation. As discussed in our previous note and as portrayed by Exhibit 3, our models point to more certainty (i.e. receding uncertainty) about well-anchored, benign inflation expectations.

Exhibit 4 depicts the evolution since 2003 of the 10-Year Constant Maturity Treasury yield, along with its long-term expectations, and contributions from long-term growth expectations, growth uncertainty, and long-term inflation expectations, as implied by our models. As was the case for real yields, long-term growth expectations contribute positively to (nominal) government bond yields, while growth uncertainty contributes negatively. In addition, long-term inflation expectations also contribute positively. Interestingly, Exhibit 4 shows that the increase in nominal yields through 2022 and November 2023 was driven, as in the case of real yields, by the recovery in long-term growth expectations and the decline in growth uncertainty - and not by (unchanged and rather benign) long-term inflation expectations.
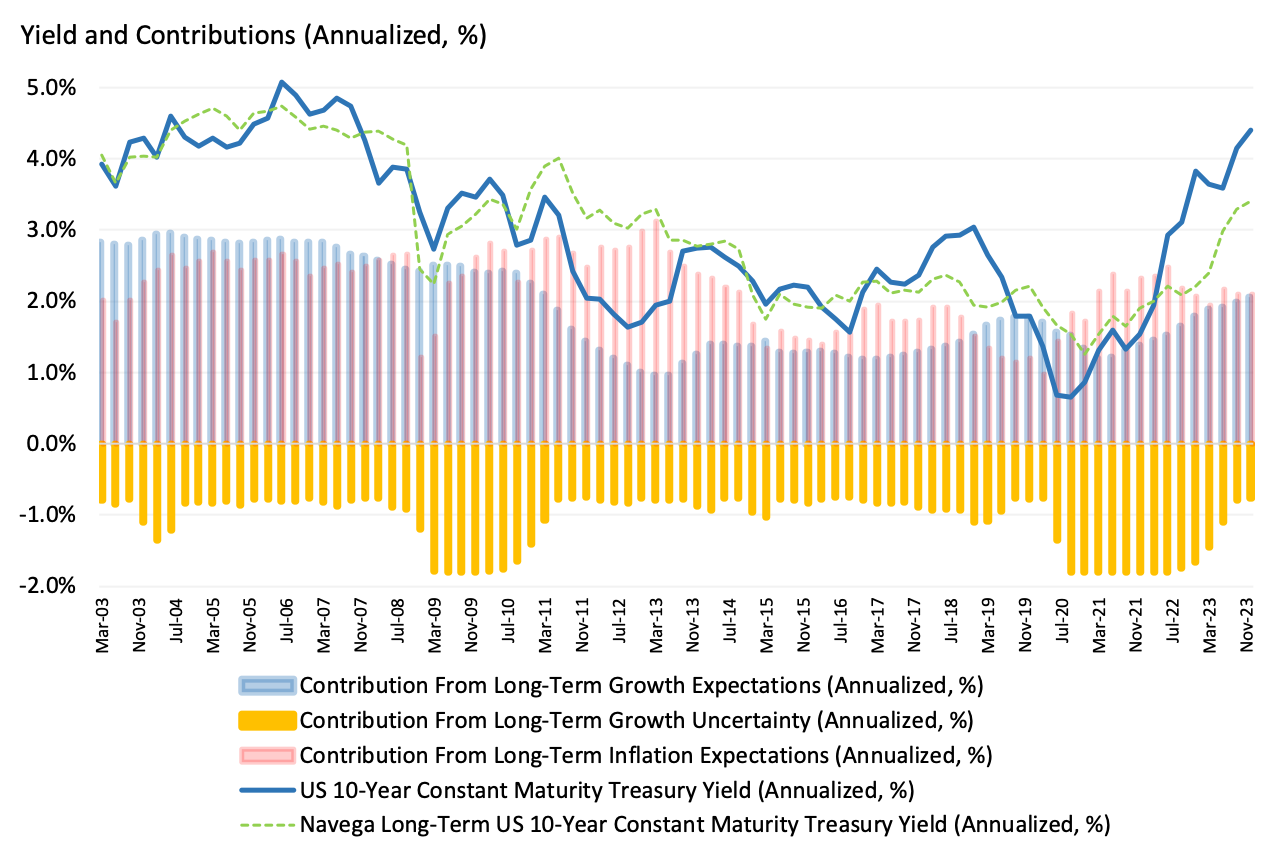
Going forward, according to our models, the path for real and nominal bond yields depend on the path for future real economic growth expectations, growth uncertainty, and long-term inflation expectations. For example, should long-term real growth expectations remain at current (relatively low by historical standard) levels and should uncertainty increase back to its benign (pre-GFC average) level (consistent with our most likely scenario) our models imply that the 10-Year (CMT) TIPS yield could well decline from its current level of 171bps to about 90bps. Moreover, should inflation expectations remain well-anchored and benign at about 2.1% (as discussed in our previous note), the 10-Year (CMT) Treasury yield could decline from the current level of 390bps to about 300bps.
What next for investors? One key takeaway is that investors should refrain from relying on pundits' and market commentators' views based on single (often uninformed and potentially biased) point estimates. Instead, they are better served by focusing on the sources of long-term growth and inflation expectations and uncertainty, and evaluating the impact of alternative scenarios (including those of pundits) of long-term growth and inflation expectations (and uncertainty) on bond markets. One other takeaway is that via their impact on interest (discount) rates and dividend growth, long-term growth and inflation expectations also drive equity valuations and returns. We will explore these implications for equity markets in subsequent notes.
This document is for informational purposes only. This document is intended exclusively for the person to whom it has been delivered, and may not be reproduced or redistributed to any other person without the prior written consent of Navega Strategies LLC (“Navega”). The information contained herein is based on Nageva’s proprietary research analytics of data obtained from third party statistical services, company reports or communications, publicly available information, or other sources, believed to be reliable. However, Navega has not verified this information, and we make no representations whatsoever as to its accuracy or completeness. Navega does not intend to provide investment advice through this document. This document is in no way an offer to sell or a solicitation of an offer to buy any securities. Investing in securities involves risk of loss, including a loss of principal, that clients should be prepared to bear. Past performance is not indicative of future results, which may vary materially. While this summary highlights important data, it does not purport to capture all dimensions of risk. The methodology used to aggregate and analyze data may be adjusted periodically. The results of previous analyses may differ as a result of those adjustments. Navega has made assumptions that it deems reasonable and used the best information available in producing any calculations herein. Statements that are nonfactual in nature, including opinions, projections and estimates, assume certain economic conditions and industry developments and constitute only current opinions that could be incorrect and are subject to change without notice. All information provided herein is as of the delivery date the document (unless otherwise specified) and is subject to modification, change or supplement in the sole discretion of Navega without notice to you. This information is neither complete nor exact and is provided solely as reference material with respect to the services offered by Navega. Information throughout this document, whether stock quotes, charts, articles, or any other statement or statements regarding market or other financial information, is obtained from sources which we and our suppliers believe reliable, but we do not warrant or guarantee the timeliness or accuracy of this information. The information presented here has not been personalized, and is not based on the financial circumstances of the recipient. This information may not be applicable to your particular financial needs, and should not, by itself, be used to make determinations regarding the purchase or sale of securities, or other investment decisions.
The model performance information presented is based on the application of Navega’s factor analysis, backtested against actual historical data. “Backtesting” is a process of objectively simulating historical performance information by applying a set of rules backward in time. The results of the application of Navega’s model do not reflect actual performance or actual historical data. Such models are prepared with the full benefit of hindsight, and it is not likely that similar results could be achieved in the future.
The model portfolios were constructed by Navega with the benefit of hindsight to illustrate certain performance metrics. The performance shown was not actually achieved by any investor. The investments in these hypothetical portfolios were selected with the full benefit of hindsight, after performance over the period shown was known. It is not likely that similar results could not be achieved in the future. The hypothetical portfolios presented here are purely illustrative, and representative only of a small sample of possible scenarios.
The projections shown do not represent actual performance, and are based on assumptions which may not occur. It is possible that the markets will perform better or worse than shown in the projections, the actual results of an investor who invests in the manner these projections suggest will be better or worse than the projections, and an investor may lose money by relying on these projections.