The April CPI inflation rate figure of 8.3% (year-on-year) is likely to add to anxieties about future inflation, even though it is slightly down from March's 8.5%. In our view, articles and opinion pieces that proclaim that central bankers have been derelict in their duty do not serve investors well . Instead, investors should differentiate between demand- and supply- side drivers of inflation. Our analysis suggests that the most recent data from the bond market are consistent with a demand-side inflation expectation of 2.6%, with the rest reflecting supply-side pressures.
With the emergence of higher inflation rates post-pandemic, significant commentary has been made about central bank mis-management of monetary policy. For instance, the Washington Post has featured opinion pieces on this theme by Larry Summers, and The Economist devoted a cover and a policy brief to the Fed’s mismanagement. Although these commentaries acknowledge the distinction between demand- and supply-side effects, the analysis and recommendations almost all seem to lead to demand management (or mismanagement).
Specifically, the argument is that fiscal and monetary policy have been too stimulative. The impact of the stimulus is observed in tight labor markets and wage inflation, and hence general price inflation. This analysis would imply that (a) the impact of supply-side drivers of observed inflation are small relative to the demand-side drivers and (b) market pricing of inflation expectations are flat out wrong.
Our preference is to interpret realized inflation data under the assumption that the bond market is the best initial forecast of future inflation. With this assumption, observed differences can be conveniently separated into demand and supply side effects. This structure helps us unravel whether the bond market judges the paths of monetary and fiscal policy as credible.
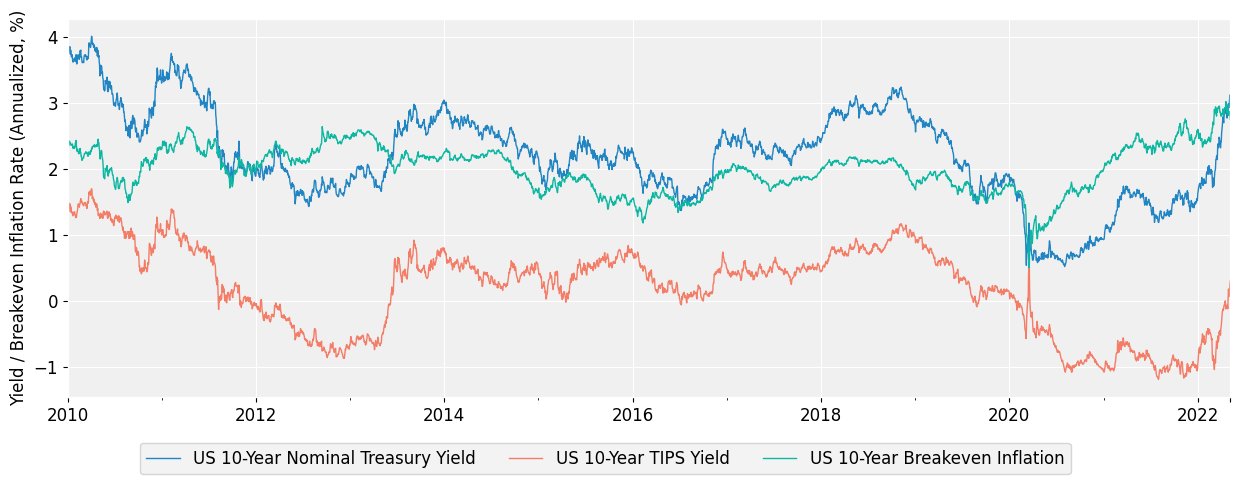
Exhibit 1 plots the US 10-Year (nominal) Treasury yield and the US 10-year (real) TIPS yield, and their difference from 2010-2022. We interpret the difference - the 10-year breakeven inflation rate - as the market’s expectation for inflation. What is striking about the exhibit is how little actual variation we’ve seen in the last 12 years. Although nominal rates are higher in May, 2022 than in January, 2022, the increase has largely been driven by the increase in real rates. Market-based inflation expectations have increased only 20-30 basis points since the beginning of 2022.
To evaluate policy credibility, we use government budget accounting to link inflation expectations to monetary and fiscal policy paths . In principle, less credible monetary policy and fiscal policy would lead to higher market-based expectations of inflation and vice versa.
Why would the bond market judge fiscal and monetary policy (i.e. the demand-side) to be credible? In our minds, there are three reasons specific to Fed policy, and two specific to fiscal policy. Looking first at monetary policy, here are three important Fed announcements:
Long-term growth and inflation expectations of about 1.9% and 2.0% respectively .
Seven rate hikes planned for 2022.
The start of quantitative tightening.
Given that the Fed has stated their expectations for long-term inflation (point 1), and that they control one important lever in setting inflation expectations, it is hard for us to judge points (2) and (3) as anything but adding to policy credibility.
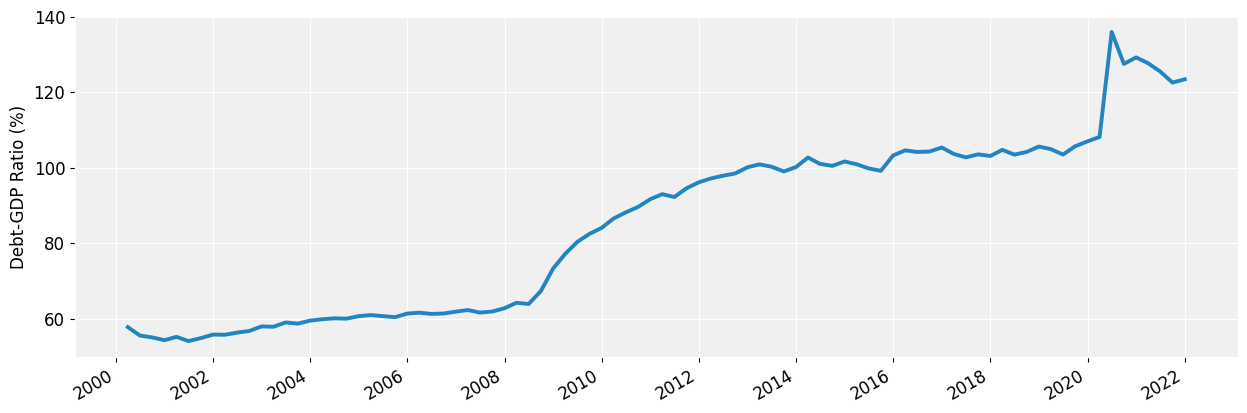
On the fiscal policy side, there are two important points to make. First, as shown in Exhibit 2, the debt-to-gdp ratio has started to decline. More importantly, further expansion of deficit financing strikes us as politically unlikely (with the failed BBB bill and the likely GOP control of at least one side of Congress as exhibits A and B).
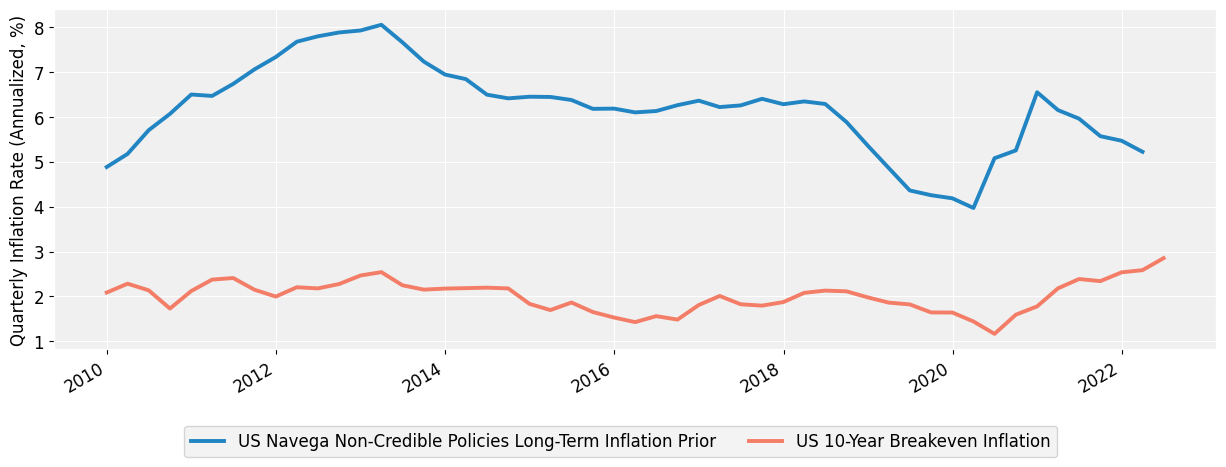
The bottom line is that bond market participants view fiscal and monetary policy as generally credible, and are pricing long-term inflation expectations accordingly. Indeed, on our calculations, as shown in Exhibit 3, market-based expectations are around 200 basis points lower than they would be if policy was not judged to be credible.
With market-based inflation expectations of around 265 basis points (as of May, 10, 2022), it seems clear to us that the remaining 565 basis points of reported inflation (annual inflation rate, as of April, 2022) can easily be attributable to supply-side effects. As is well known, supply-side inflation is driven by the presence of frictions to market pricing. These frictions dissipate when normal market-based mechanisms are allowed to function. The end composition of the basket of goods and services may change, but the long-term effect on general inflation should be nil. Should these frictions become further amplified, however, observed inflation could continue to rise.
Investors would be well advised to remember that demand side management is potentially ineffective in managing supply side shocks. To give a current example: chip production in China has dropped dramatically as a response to Covid outbreaks in China. It seems absurd to us to suggest that Fed policy can do much of anything about either chip production or Covid in China.
The two main issues for investors are: first, use available market-based vehicles (e.g. TIPS, inflation swaps) to manage exposures to demand-side driven inflation shocks. Additionally, they should consider investments (e.g. equities) whose long-term (inflation-adjusted) cash flows are invariant to demand-side inflation shocks.
Secondly, they should treat supply-side inflation shocks as opportunities. These shocks are produced by market frictions, and those frictions need to be resolved. Investment opportunities certainly exist in friction resolution. For example, although high oil prices are profitable for oil producers, they also provide signals for investors interested in financing cheaper substitutes. We will continue exploring this theme in future notes.
This document is for informational purposes only. This document is intended exclusively for the person to whom it has been delivered, and may not be reproduced or redistributed to any other person without the prior written consent of Navega Strategies LLC (“Navega”). The information contained herein is based on Nageva’s proprietary research analytics of data obtained from third party statistical services, company reports or communications, publicly available information, or other sources, believed to be reliable. However, Navega has not verified this information, and we make no representations whatsoever as to its accuracy or completeness. Navega does not intend to provide investment advice through this document. This document is in no way an offer to sell or a solicitation of an offer to buy any securities. Investing in securities involves risk of loss, including a loss of principal, that clients should be prepared to bear. Past performance is not indicative of future results, which may vary materially. While this summary highlights important data, it does not purport to capture all dimensions of risk. The methodology used to aggregate and analyze data may be adjusted periodically. The results of previous analyses may differ as a result of those adjustments. Navega has made assumptions that it deems reasonable and used the best information available in producing any calculations herein. Statements that are nonfactual in nature, including opinions, projections and estimates, assume certain economic conditions and industry developments and constitute only current opinions that could be incorrect and are subject to change without notice. All information provided herein is as of the delivery date the document (unless otherwise specified) and is subject to modification, change or supplement in the sole discretion of Navega without notice to you. This information is neither complete nor exact and is provided solely as reference material with respect to the services offered by Navega. Information throughout this document, whether stock quotes, charts, articles, or any other statement or statements regarding market or other financial information, is obtained from sources which we and our suppliers believe reliable, but we do not warrant or guarantee the timeliness or accuracy of this information. The information presented here has not been personalized, and is not based on the financial circumstances of the recipient. This information may not be applicable to your particular financial needs, and should not, by itself, be used to make determinations regarding the purchase or sale of securities, or other investment decisions.
The model performance information presented is based on the application of Navega’s factor analysis, backtested against actual historical data. “Backtesting” is a process of objectively simulating historical performance information by applying a set of rules backward in time. The results of the application of Navega’s model do not reflect actual performance or actual historical data. Such models are prepared with the full benefit of hindsight, and it is not likely that similar results could be achieved in the future.
The model portfolios were constructed by Navega with the benefit of hindsight to illustrate certain performance metrics. The performance shown was not actually achieved by any investor. The investments in these hypothetical portfolios were selected with the full benefit of hindsight, after performance over the period shown was known. It is not likely that similar results could not be achieved in the future. The hypothetical portfolios presented here are purely illustrative, and representative only of a small sample of possible scenarios.
The projections shown do not represent actual performance, and are based on assumptions which may not occur. It is possible that the markets will perform better or worse than shown in the projections, the actual results of an investor who invests in the manner these projections suggest will be better or worse than the projections, and an investor may lose money by relying on these projections.