The US dollar appreciated 14% year-to-date against major world currencies (annualized, in inflation-adjusted and trade-weighted terms). This scale of appreciation has not been witnessed in the last 22 years - the US dollar even reached parity with the Euro. Market commentaries have been quick to emphasise potential risks to financial and economic instability posed by a surging, strong greenback. Of course, inflation was tagged as a likely culprit. However, before jumping to hasty conclusions, investors should be well advised to examine the long-term, macro sources of currency trends. According to our models, the continued appreciation of the US dollar was driven by the relative increase in US long-term real economic growth expectations and relative decrease in long-term growth uncertainty compared to its major trade partners (including China). Going forward, the strength of the US dollar and global financial stability will continue to depend on US relative real economic growth prospects.

Let's drill down into the sources of recent trends in currency markets in sequence. Exhibit 1 depicts the evolutions, from January 2021 through October 2022, of USD spot and 3-month forward exchange rates against the British pound (GBP) and the euro, and the Japanese yen spot and 3-month forward rates against the USD. According to the Exhibit, the relative appreciation of the USD against these major currencies was already under way in 2021, but became particularly pronounced since the start of this year. Year-to-date, the US dollar appreciated about 16% against the pound sterling, 13% against the euro - reaching parity - and 27% against the yen.
To make sense of the dramatic scale of these fluctuations, it is reasonable to ask ourselves how much of the change in spot rates had already been priced in currency forward markets? According to Exhibit 1, the 3-month forward rates have not been signalling future declines in spot rates, at least over the 3-month horizon. In fact, the USD/GBP, USD/EUR, and USD/JPY forward exchange rates have been declining in tandem with spot rates, at a slightly slower pace.
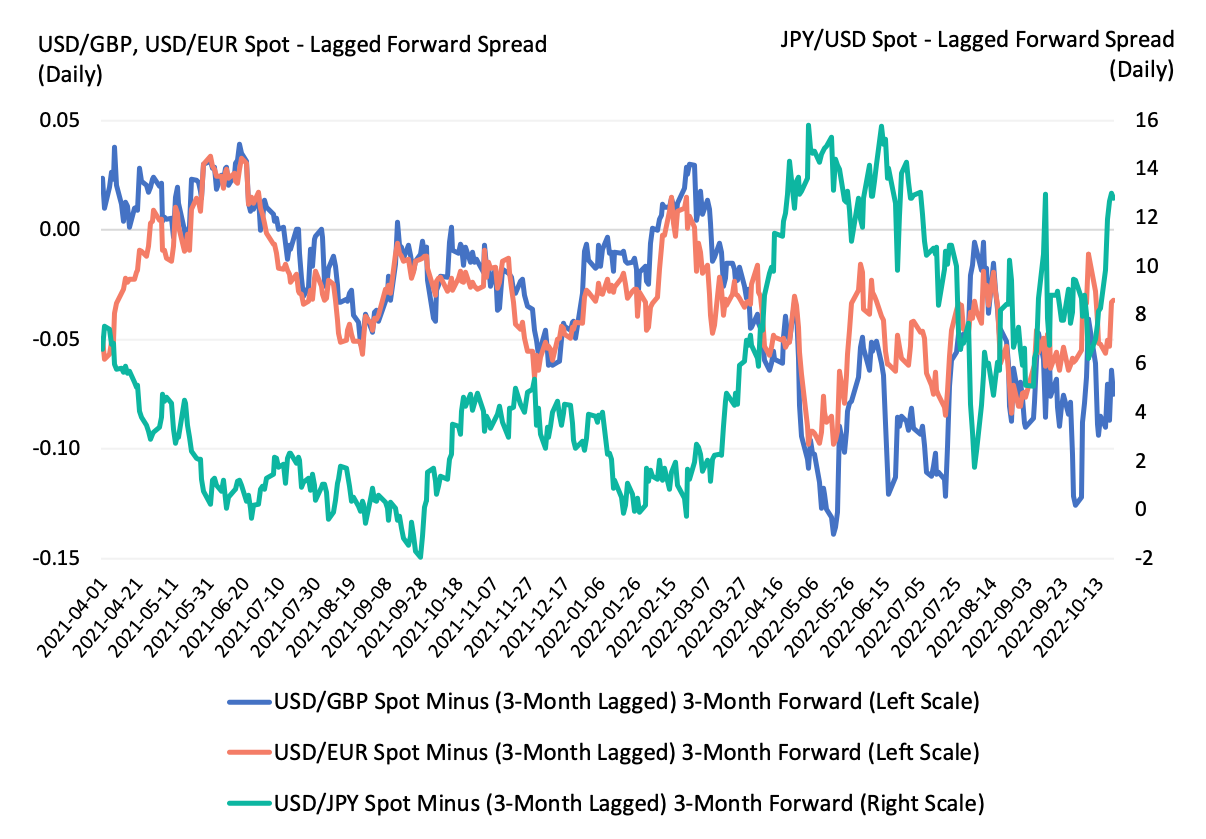
Exhibit 2 corroborates these observations, depicting the evolution of the spread between the spot and the lagged forward exchange rates (3-month lagged, 3-month forward) for the same currency pairs. For the most part and especially since February 2022, forward exchange rates have remained higher than the subsequent realised spot rates. In addition, Exhibit 2 shows that since February 2022, currency forward markets have been failing to anticipate (on a continued-basis) the scale of the changes in cross-country interest rate spreads.
Taken together, Exhibit 1 and Exhibit 2 indicate that the bulk (nearly 100%, on average) of the (continued) year-to-date appreciation of the US dollar can be attributed to unanticipated changes in cross-country interest rates differentials.

The next question, then, for investors, is what are the sources of the changes in interest rate spread expectations (US yields relative to the rest of the world)? To address this issue, our models suggest that investors are well advised to focus on the long-term, macro sources. We first recall the conclusions from our previous paper that the recent increases in nominal government bond yields (in each country) were primarily driven by increases in real (inflation-adjusted) yields - not inflation. Thus, safely abstracting from inflation, Exhibit 3 shows our model-implied long-term yield spreads for UK, Euro area, Japan and China 10-year (constant maturity) inflation-linked government bonds relative to the US. According to the Exhibit, for each country, year-to-date long-term expectations of real yields decreased in relation to the US. Moreover, according to our models, real yields are driven by long-term growth and growth uncertainty. In turn, as shown in Exhibit 3, these relative decreases in real yield expectations can be traced to corresponding relative decreases in long-term real GDP growth expectations in each country, and with the exception of Japan, relative increases in long-term growth uncertainty.
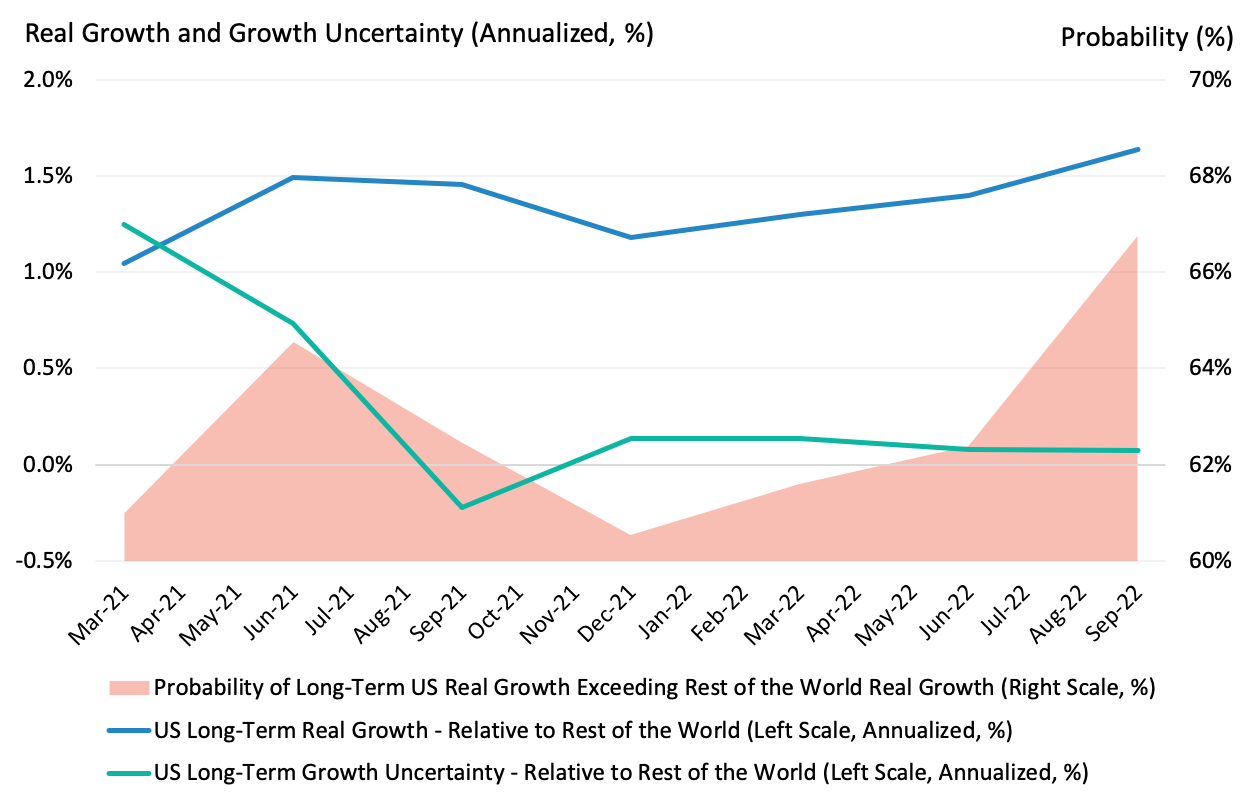
In other words, the continued year-to-date strengthening of the US dollar is primarily driven by expectations of improved US real economic growth prospects relative the rest of the world (i.e. higher long-term growth with lower growth uncertainty). Digging deeper, our models also suggest that these improved US relative growth prospects have been driven by expectations of relatively higher total factor productivity (TFP) growth in the US. This point is further depicted in Exhibit 4. The Exhibit shows the evolution since March 2021 of the probability of US long-term real GDP growth exceeding the rest of the world long-term growth. According to the Exhibit, since the start of the year, the probability has increased from about 60% to 67%. As discussed in our previous paper, high probability values can be tied to the privileged status of US dollar denominated assets. A dominant US dollar could indeed be a source of global financial instability if relative US growth prospects are expected to significantly deteriorate, on a continued basis.
Going forward, long-term investors concerned with the future direction of the US dollar are well advised to envision alternative scenarios of long-term drivers of US real economic growth and growth uncertainty relative to major economies, and trace these alternative scenarios' impact on global real economic growth, inflation, asset and currency returns in a systematic fashion.
This document is for informational purposes only. This document is intended exclusively for the person to whom it has been delivered, and may not be reproduced or redistributed to any other person without the prior written consent of Navega Strategies LLC (“Navega”). The information contained herein is based on Nageva’s proprietary research analytics of data obtained from third party statistical services, company reports or communications, publicly available information, or other sources, believed to be reliable. However, Navega has not verified this information, and we make no representations whatsoever as to its accuracy or completeness. Navega does not intend to provide investment advice through this document. This document is in no way an offer to sell or a solicitation of an offer to buy any securities. Investing in securities involves risk of loss, including a loss of principal, that clients should be prepared to bear. Past performance is not indicative of future results, which may vary materially. While this summary highlights important data, it does not purport to capture all dimensions of risk. The methodology used to aggregate and analyze data may be adjusted periodically. The results of previous analyses may differ as a result of those adjustments. Navega has made assumptions that it deems reasonable and used the best information available in producing any calculations herein. Statements that are nonfactual in nature, including opinions, projections and estimates, assume certain economic conditions and industry developments and constitute only current opinions that could be incorrect and are subject to change without notice. All information provided herein is as of the delivery date the document (unless otherwise specified) and is subject to modification, change or supplement in the sole discretion of Navega without notice to you. This information is neither complete nor exact and is provided solely as reference material with respect to the services offered by Navega. Information throughout this document, whether stock quotes, charts, articles, or any other statement or statements regarding market or other financial information, is obtained from sources which we and our suppliers believe reliable, but we do not warrant or guarantee the timeliness or accuracy of this information. The information presented here has not been personalized, and is not based on the financial circumstances of the recipient. This information may not be applicable to your particular financial needs, and should not, by itself, be used to make determinations regarding the purchase or sale of securities, or other investment decisions.
The model performance information presented is based on the application of Navega’s factor analysis, backtested against actual historical data. “Backtesting” is a process of objectively simulating historical performance information by applying a set of rules backward in time. The results of the application of Navega’s model do not reflect actual performance or actual historical data. Such models are prepared with the full benefit of hindsight, and it is not likely that similar results could be achieved in the future.
The model portfolios were constructed by Navega with the benefit of hindsight to illustrate certain performance metrics. The performance shown was not actually achieved by any investor. The investments in these hypothetical portfolios were selected with the full benefit of hindsight, after performance over the period shown was known. It is not likely that similar results could not be achieved in the future. The hypothetical portfolios presented here are purely illustrative, and representative only of a small sample of possible scenarios.
The projections shown do not represent actual performance, and are based on assumptions which may not occur. It is possible that the markets will perform better or worse than shown in the projections, the actual results of an investor who invests in the manner these projections suggest will be better or worse than the projections, and an investor may lose money by relying on these projections.