Portfolio decisions comprise not only decisions about how to invest - the investment portfolio - but also about how much to invest - contributions (or savings). Traditional portfolio advice has the tendency to focus on the former and largely ignored the latter. In our view, savings decisions - how much and when - matters as much as the allocation strategy itself in improving financial wealth outcomes.
Our starting point is the equilibrium framework we discussed in our previous note. As shown in the note, our framework differs from the standard one-size-fits-all approach and provides a robust foundation to differentiated portfolio advice by taking seriously the ideas of:
Capital market equilibrium – for every investor who chooses to overweight an asset class (relative to market capitalization weights), there must be an investor who chooses to underweight.
Heterogeneity across investors – investors are not the same.
Managing macroeconomic shocks.
In our framework, individuals accumulate wealth during working life by deciding how much to save (or spend), and how to invest those savings in a combination of risky and risk-free assets, given macroeconomic conditions (both current and future prospects), their attitude towards risk, and their income. After retirement, assumed to be at age 65, they spend out of their accumulated wealth. Finally, all individuals’ savings and asset holdings should add up to aggregate savings and aggregate market cap weights for each asset class.
Accordingly, individuals vary in their portfolio allocations, following a glidepath. While holding assets in their market cap weights (with a 65/35 risky assets/bonds split) could make sense around retirement age (in the US), younger individuals can bear more macro risk with growth-sensitive allocations - earning a higher expected return. Older individuals are more sensitive to macro risk and tilt towards growth-defensive assets and government bonds - with lower returns but also less risk.
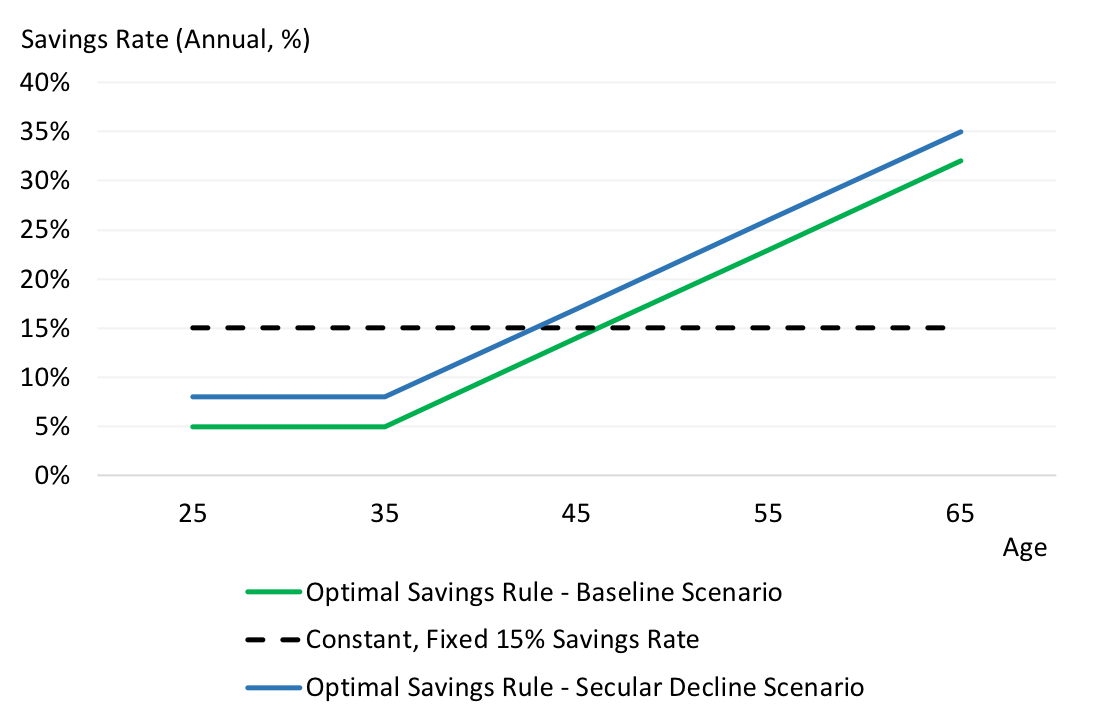
By contrast to standard practice that tends to fix the savings rate at a constant rate (often too low and arbitrary), our framework implies that savings and contributions should also vary, primarily by age, and be aligned with macro conditions. Exhibit 1 shows the savings glidepath that is aligned with the allocations glidepath. The savings (contributions) rate stays flat from early- to mid- working life at a meagre 5% per year. Spending accounts for much of the typically small earnings made at that stage, the retirement horizon is still distant, and risky asset holdings have higher expected rates of return. However the rate then increases on a continued basis through retirement to help maintain a similar level of spending pre- and post-retirement, finally reaching about 32% (on average across investors).

Exhibit 1 also shows that the savings rate should depend on expected macro conditions. For example, under a scenario envisioning a prolonged decline in real economic growth trend, savings rates should increase. Interestingly, the two significant macro events of the last 70 years - the 2008 Global Financial Crisis (GFC) and Covid-19 - have both been associated with increases in the average personal savings rate. As a historical example of a significant continued decline in trend growth, the GFC case is particularly revealing. While US real GDP growth decreased on average from 2.5% (average from 2000 to 2008) to 1.5% (average from 2009 to 2019), the average personal savings rate in the US increased from 4% to 7% over the same periods. Our models help decode these apparent linkages between savings and macro risk. According to our models, a prolonged period of slow or lower real growth erodes both real investment returns and real income growth, leading to a knock-on effect on accumulated wealth. Increasing the savings rate help compensate for the loss of income.
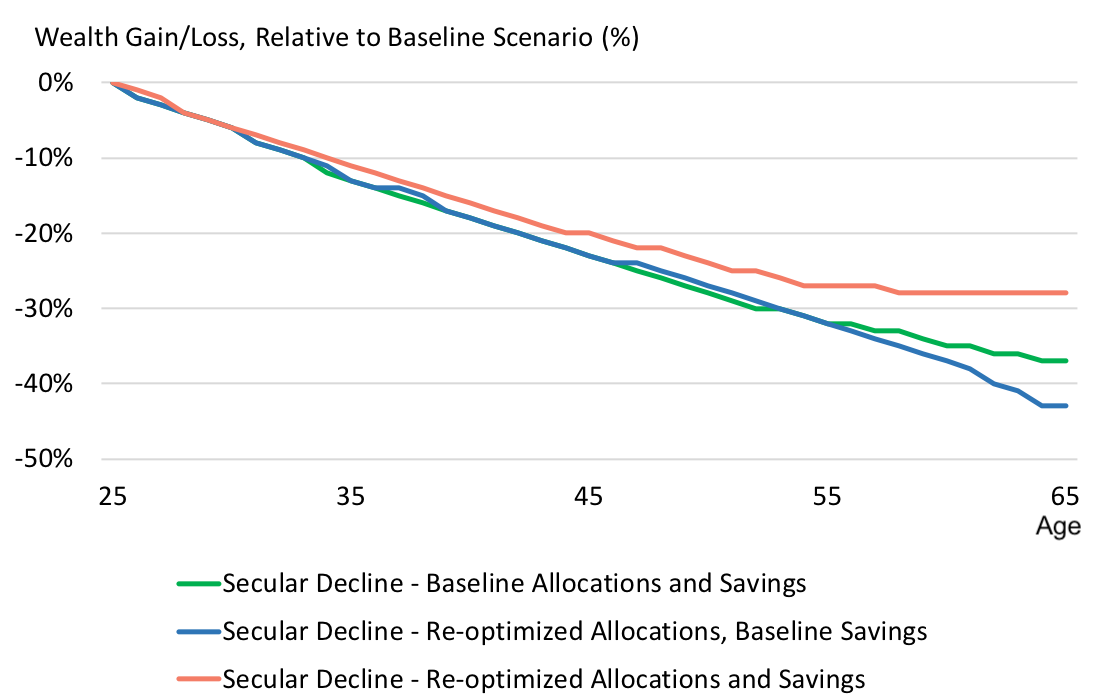
Exhibit 2 illustrates this point. According to our models, should savings and allocations remain unchanged (i.e. still aligned with our baseline macro scenario), a secular 100bps decline in trend economic growth relative to our baseline could result in a -37% loss in retirement wealth (relative to the current baseline macro scenario). Simply re-aligning portfolio allocations (shifting towards less risky assets, in this case) would not help. While barely improving wealth outcomes in early- and mid- working life, retirement wealth could fare even worse, with an expected loss over -40%. However, adjusting and increasing the savings rate through working life, in addition to de-risking the portfolio allocations, could help limit the retirement loss to -28%.

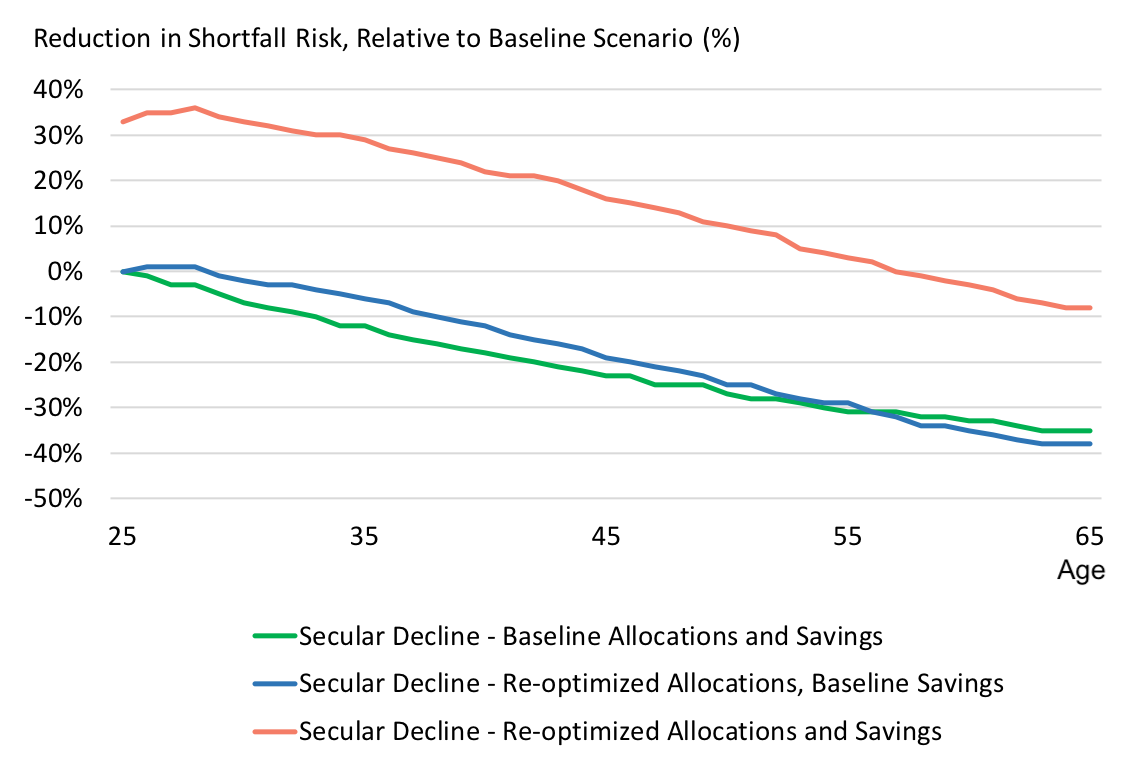
Moreover, as shown in Exhibit 3, adjusting savings rates could also help mitigate shortfall risks (as measured by the 5th percentile of the wealth distribution). Again, simply adjusting the portfolio allocations would only barely help. Aligning the savings rate, however, could even help reduce shortfall risk (relative to the current baseline macro scenario) by as much as 20% on average through working life. Around retirement, the incremental increase in shortfall risk would be only about 5%, relative to the current baseline macro scenario, by contrast to the 40% increase potentially incurred by leaving savings and allocations unchanged or only re-aligning the portfolio allocations.

Our equilibrium, macro-based models and framework for differential portfolio advice allow investors to align savings and allocation strategies with changes in long-term macroeconomic conditions, and trace the impact on wealth outcomes in a systematic fashion. Our models indicate that, when faced with the prospect of lower growth, focusing on investment returns alone may not be enough to improve wealth outcomes near retirement. Investors should also revisit their savings strategy to help compensate for the loss of income. Taken together, adjusting the savings rate and tailoring allocation strategies to macro views markedly improve near retirement wealth outcomes.
This document is for informational purposes only. This document is intended exclusively for the person to whom it has been delivered, and may not be reproduced or redistributed to any other person without the prior written consent of Navega Strategies LLC (“Navega”). The information contained herein is based on Nageva’s proprietary research analytics of data obtained from third party statistical services, company reports or communications, publicly available information, or other sources, believed to be reliable. However, Navega has not verified this information, and we make no representations whatsoever as to its accuracy or completeness. Navega does not intend to provide investment advice through this document. This document is in no way an offer to sell or a solicitation of an offer to buy any securities. Investing in securities involves risk of loss, including a loss of principal, that clients should be prepared to bear. Past performance is not indicative of future results, which may vary materially. While this summary highlights important data, it does not purport to capture all dimensions of risk. The methodology used to aggregate and analyze data may be adjusted periodically. The results of previous analyses may differ as a result of those adjustments. Navega has made assumptions that it deems reasonable and used the best information available in producing any calculations herein. Statements that are nonfactual in nature, including opinions, projections and estimates, assume certain economic conditions and industry developments and constitute only current opinions that could be incorrect and are subject to change without notice. All information provided herein is as of the delivery date the document (unless otherwise specified) and is subject to modification, change or supplement in the sole discretion of Navega without notice to you. This information is neither complete nor exact and is provided solely as reference material with respect to the services offered by Navega. Information throughout this document, whether stock quotes, charts, articles, or any other statement or statements regarding market or other financial information, is obtained from sources which we and our suppliers believe reliable, but we do not warrant or guarantee the timeliness or accuracy of this information. The information presented here has not been personalized, and is not based on the financial circumstances of the recipient. This information may not be applicable to your particular financial needs, and should not, by itself, be used to make determinations regarding the purchase or sale of securities, or other investment decisions.
The model performance information presented is based on the application of Navega’s factor analysis, backtested against actual historical data. “Backtesting” is a process of objectively simulating historical performance information by applying a set of rules backward in time. The results of the application of Navega’s model do not reflect actual performance or actual historical data. Such models are prepared with the full benefit of hindsight, and it is not likely that similar results could be achieved in the future.
The model portfolios were constructed by Navega with the benefit of hindsight to illustrate certain performance metrics. The performance shown was not actually achieved by any investor. The investments in these hypothetical portfolios were selected with the full benefit of hindsight, after performance over the period shown was known. It is not likely that similar results could not be achieved in the future. The hypothetical portfolios presented here are purely illustrative, and representative only of a small sample of possible scenarios.
The projections shown do not represent actual performance, and are based on assumptions which may not occur. It is possible that the markets will perform better or worse than shown in the projections, the actual results of an investor who invests in the manner these projections suggest will be better or worse than the projections, and an investor may lose money by relying on these projections.