The use of portfolio choice models to advice investors on asset allocation is a ubiquitous feature in the investment landscape. Although practitioners seemingly embrace the idea of customized portfolio advice, many of these models effectively treat investors as being homogeneous. Moreover, the disposition of the investment assets is treated separately from the savings decision. One immediate consequence of this approach is that there is a one-size-fits-all to the positioning of investment strategies.
This note explores an alternative. That alternative takes seriously the ideas of capital market equilibrium, heterogeneity across investors and the importance of managing macroeconomic shocks. In our opinion, adding these offers a systematic way to provide more extensive portfolio advice. That advice explicitly moves away from the blunt force of one-size-fits-all investment strategies. Fortunately, many of the analytic tools and databases are available to implement this approach right now.
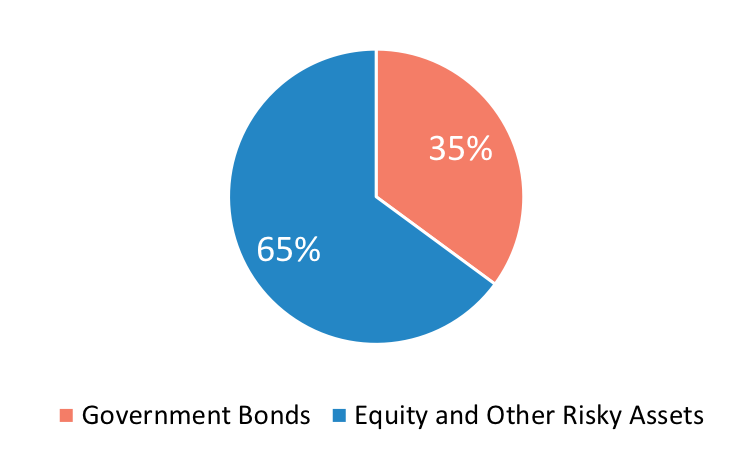
A convenient place to start the discussion is with the market weights of an identifiable subset of all assets, as shown in Exhibit 1. It is a convenient starting point because workhorse asset pricing models such as CAPM hold that all investors should hold some combination of the market portfolio and a riskless asset.
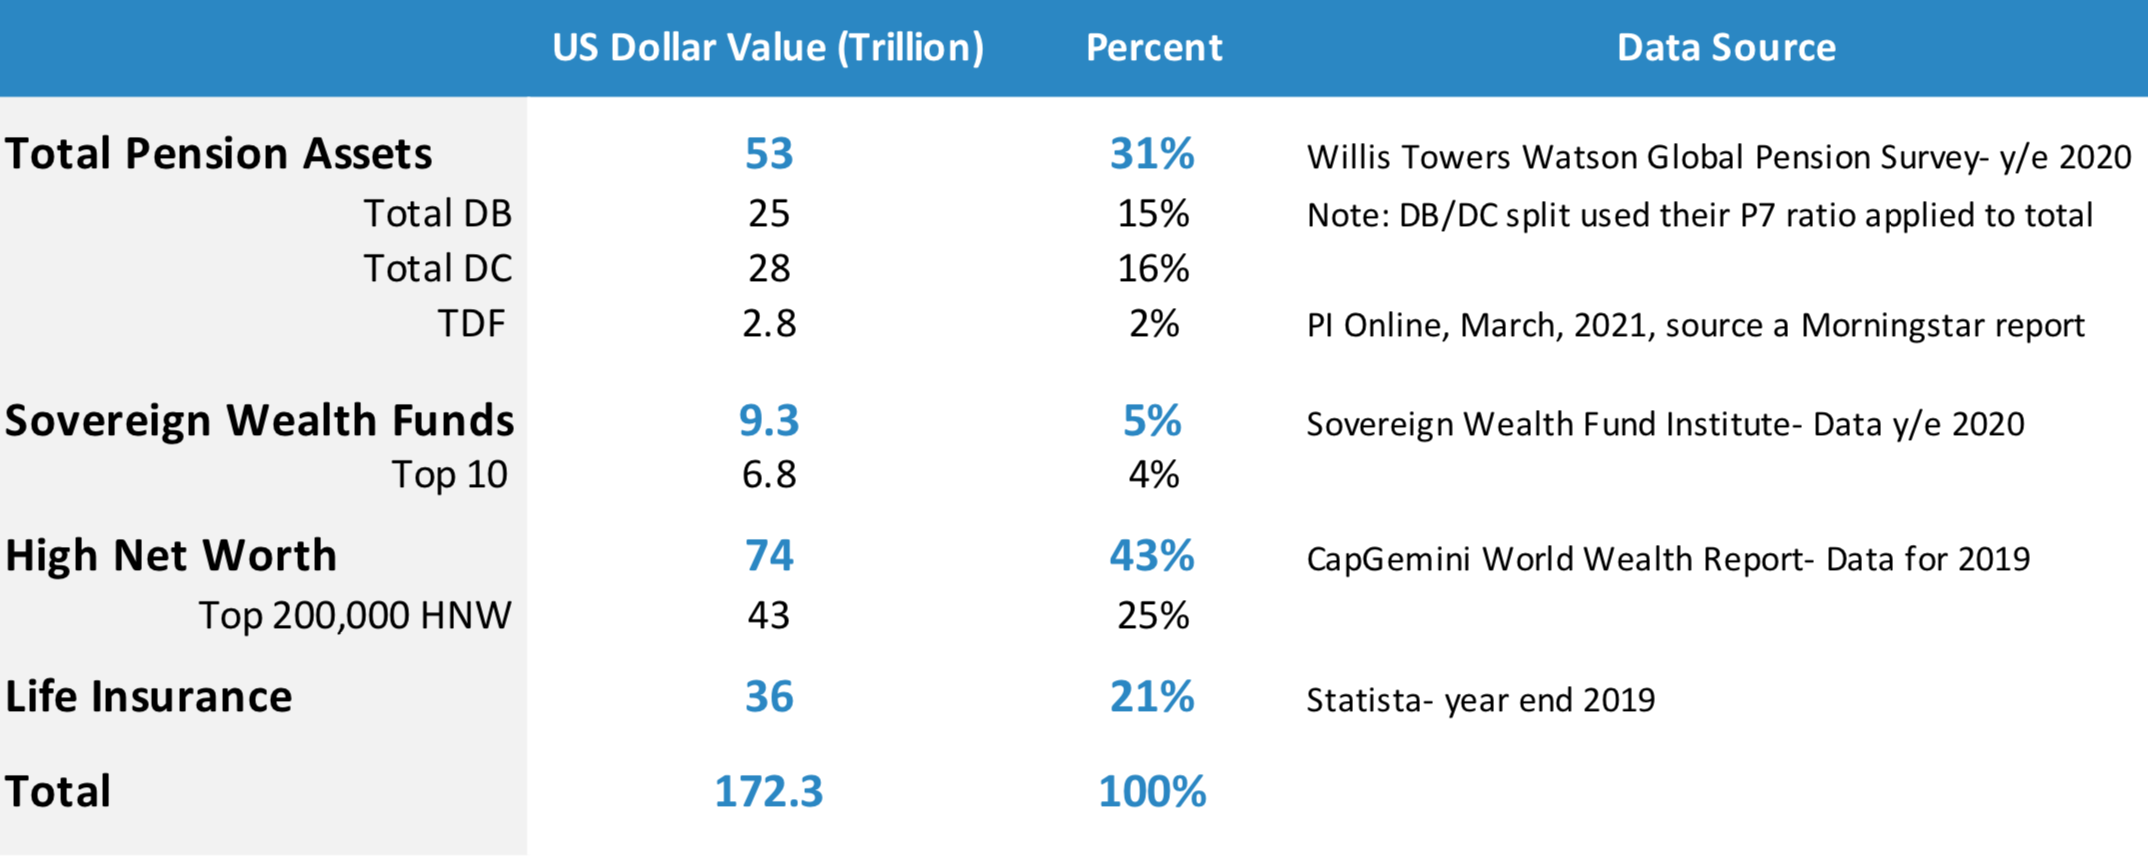
A relevant next step is to examine who holds the assets. Exhibit 2 illustrates the aggregate holdings of assets by broad investor category. Several observations are in order about the data in Exhibit 2:
Many of the asset holders in Exhibit 2 are individuals, through multiple channels
Each specific broad group has its own objective function and constraints
Many of these objectives and constraints can be known a priori
Given that there are known differences between objectives and constraints, it should not be at all surprising that asset allocation choices and rebalancing rules differ across investor types (e.g., life insurance companies versus defined benefit pensions). The question is whether there are any insights to be gained by explicitly incorporating these differences into asset allocation processes.
The key questions for identifying potential gains are the following: first, does the sum of the individual asset allocation decisions add up to the observed aggregate market portfolio; second, do the distributions (e.g., large cap versus small cap stocks) in the aggregated portfolio match those of the market portfolio.
Central to making this approach work is being explicit about the behavior of each individual investor type. To generalize, portfolio theory tells us that conditioned on paths for asset returns and income/revenue (or contributions) and constraints, investors choose paths for savings, consumption/spending and investments. The equilibrium point is that these sequences must add up to both aggregate savings and aggregate market cap weights for each specific asset class. Thus, to give sensible advice, we must be specific about the income/revenue and asset returns processes, and constraints that are specific to each investor class.
To illustrate some of the main points, let’s look at a simple example. To facilitate discussion, we’ll assume that there are only individual investors. There is a distribution of these investors across the lifecycle. Each investor is assumed to work until age 65, at which point they retire. During their working years, they save for retirement out of current income, and invest in a combination of risky and risk-free assets. Once they retire, they consume out of accumulated investments.
The main choices for each individual are: how much to consume across the lifecycle; how much to save during working years; the split between risky and risk-free assets across the lifecycle, and the allocation of risky assets across the lifecycle. We’ll assume that each individual investor solves a unique lifecycle portfolio choice problem to arrive at a glidepath for asset allocation choices across the lifecycle. We’ll also assume that each investor takes as given a set of expected asset returns, as illustrated in Exhibit 3. (The figures in Exhibit 3 show long-term premiums for macro growth-sensitive and macro growth-defensive factors).

Exhibit 4 shows the allocations to bonds and equities (in terms of growth-sensitive and growth-defensive factors) across the lifecycle. By taking the weighted average of the wealth accumulated at each point in the lifecycle, we arrive back at the original capitalization weights for each asset class. Similarly, in asset pricing equilibrium, the weighted average of the expected returns for each asset class should sum to the original expected returns.
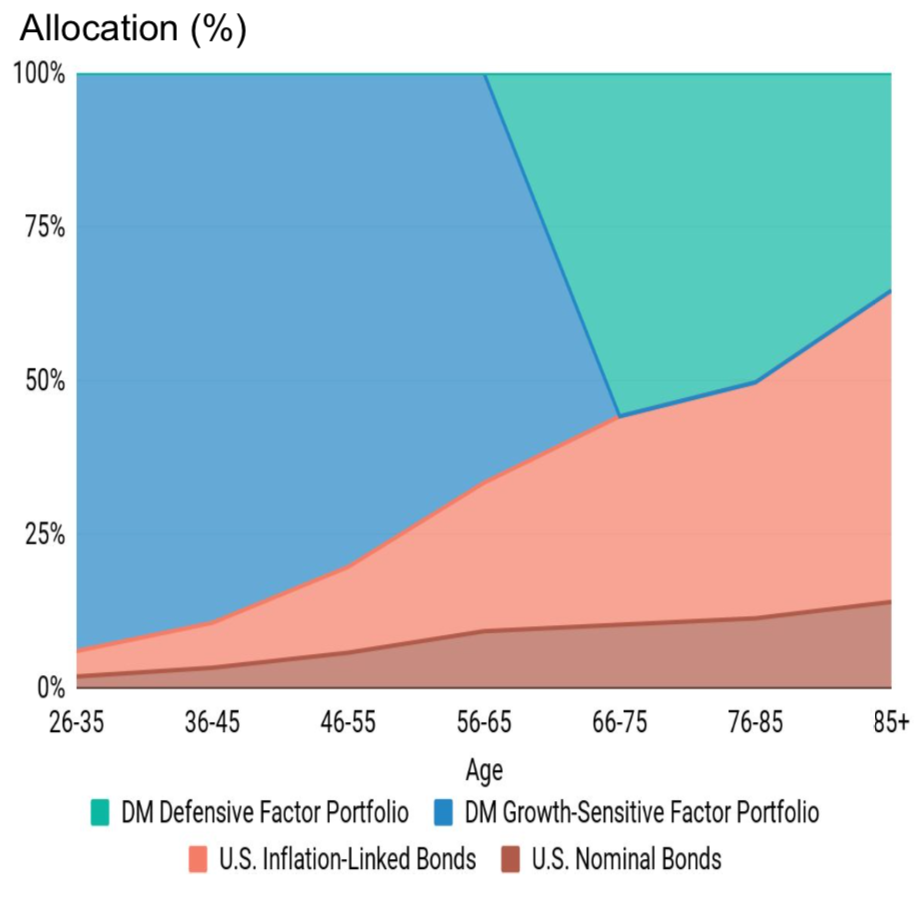
The important point in Exhibit 4 is that investors vary in their allocation to growth-sensitive and growth-defensive premiums. In this example, younger workers have higher allocations to growth-sensitive factors, while retirees have higher allocations to growth-defensive factors. Thus, differential portfolio advice has a sound economic basis.
An often-unrecognized challenge for investors is to distinguish between the wisdom and the pull of crowds. The main question that investors should ask about every investment opportunity is who is taking the other side of the bet. For every investor who chooses to overweight an asset class (relative to market capitalization weights), there must be an investor who chooses to underweight. The approach that we’ve outlined in this note provides a solid foundation to begin to better analyze and address this issue, and therefore provide better, differentiated portfolio advice.
This document is for informational purposes only. This document is intended exclusively for the person to whom it has been delivered, and may not be reproduced or redistributed to any other person without the prior written consent of Navega Strategies LLC (“Navega”). The information contained herein is based on Nageva’s proprietary research analytics of data obtained from third party statistical services, company reports or communications, publicly available information, or other sources, believed to be reliable. However, Navega has not verified this information, and we make no representations whatsoever as to its accuracy or completeness. Navega does not intend to provide investment advice through this document. This document is in no way an offer to sell or a solicitation of an offer to buy any securities. Investing in securities involves risk of loss, including a loss of principal, that clients should be prepared to bear. Past performance is not indicative of future results, which may vary materially. While this summary highlights important data, it does not purport to capture all dimensions of risk. The methodology used to aggregate and analyze data may be adjusted periodically. The results of previous analyses may differ as a result of those adjustments. Navega has made assumptions that it deems reasonable and used the best information available in producing any calculations herein. Statements that are nonfactual in nature, including opinions, projections and estimates, assume certain economic conditions and industry developments and constitute only current opinions that could be incorrect and are subject to change without notice. All information provided herein is as of the delivery date the document (unless otherwise specified) and is subject to modification, change or supplement in the sole discretion of Navega without notice to you. This information is neither complete nor exact and is provided solely as reference material with respect to the services offered by Navega. Information throughout this document, whether stock quotes, charts, articles, or any other statement or statements regarding market or other financial information, is obtained from sources which we and our suppliers believe reliable, but we do not warrant or guarantee the timeliness or accuracy of this information. The information presented here has not been personalized, and is not based on the financial circumstances of the recipient. This information may not be applicable to your particular financial needs, and should not, by itself, be used to make determinations regarding the purchase or sale of securities, or other investment decisions.
The model performance information presented is based on the application of Navega’s factor analysis, backtested against actual historical data. “Backtesting” is a process of objectively simulating historical performance information by applying a set of rules backward in time. The results of the application of Navega’s model do not reflect actual performance or actual historical data. Such models are prepared with the full benefit of hindsight, and it is not likely that similar results could be achieved in the future.
The model portfolios were constructed by Navega with the benefit of hindsight to illustrate certain performance metrics. The performance shown was not actually achieved by any investor. The investments in these hypothetical portfolios were selected with the full benefit of hindsight, after performance over the period shown was known. It is not likely that similar results could not be achieved in the future. The hypothetical portfolios presented here are purely illustrative, and representative only of a small sample of possible scenarios.
The projections shown do not represent actual performance, and are based on assumptions which may not occur. It is possible that the markets will perform better or worse than shown in the projections, the actual results of an investor who invests in the manner these projections suggest will be better or worse than the projections, and an investor may lose money by relying on these projections.