As major countries have started to ease restrictions on social and business activities, investors remain rightly concerned about the speed of economic recovery and its impact on corporate dividend payouts. While a quick return to 2019 macro conditions within the next 18 months could leave prospects for future dividend payouts nearly unchanged, a delayed recovery can elevate risks to payouts for a prolonged period of time. The potential for large shocks to trend economic growth and their impact on dividend payouts to persist matters for long-term investors as these shocks drive long-term portfolio risk, returns and decisions.
To grapple with these issues, we find it insightful to frame the current context through historical perspective. Exhibit 1 describes the five major economic crises of the past 100 years - including the Covid-19 induced crisis - in terms of their time to recovery and impact on real economic trend growth and uncertainty. In all cases, the severity and duration of shocks to the real economy were extreme, to say the least, with the Great Depression (1929-1933), the 2008 Global Financial Crisis (GFC), and Covid-19 markedly standing out. Not surprisingly, the Great Depression experienced the deepest economic recession (-12% average annualized decline in real GDP) and the longest recovery time to date (43 months), and in turn, the largest increase in macro uncertainty (84%) .
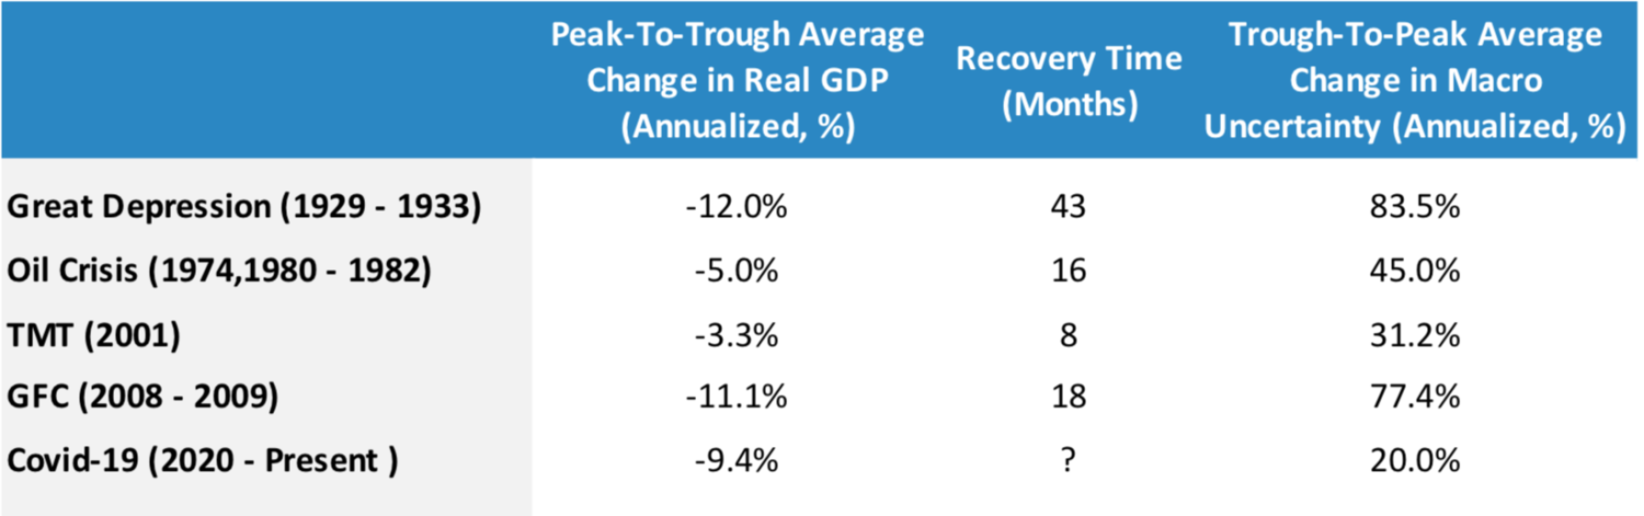
The 2008 Global Financial Crisis (GFC) also experienced persistent declines in annualized growth rates for a prolonged period of time, leading to a large increase in macro uncertainty (77%). By contrast to the Great Depression though, effective monetary and fiscal policies may have contributed to limit the impact and duration of the crisis. What about Covid-19? While the short-term drop in real output could be comparable in magnitude to the 1929 and 2008 experience, it is still too early to assess the longer-term macro impact. Thus our models only indicate a mild increase in macro uncertainty so far, reflecting our baseline scenario of a return to 2019 macro conditions in the next 18 months in the US .
Large and persistent shocks to the real economy matter for investors as such shocks are likely to put acute pressures on corporate balance sheets for a prolonged period of time, leading to sharp declines in dividend payouts - which in turn drive long-term portfolio variability and returns. Exhibit 2 shows this has indeed been the case for all major crises, including Covid-19. More precisely, equity market dividends per share experienced annualized average declines ranging from -26% in the case of the 1970s Oil Crises to as much as -40% in the case of the GFC. And as it happened, during the Great Depression, small cap stocks and value stocks even stopped paying dividends over a 17-month stretch! In addition, shortfalls in dividends per share appeared to increase with the change in macro uncertainty witnessed during crisis.
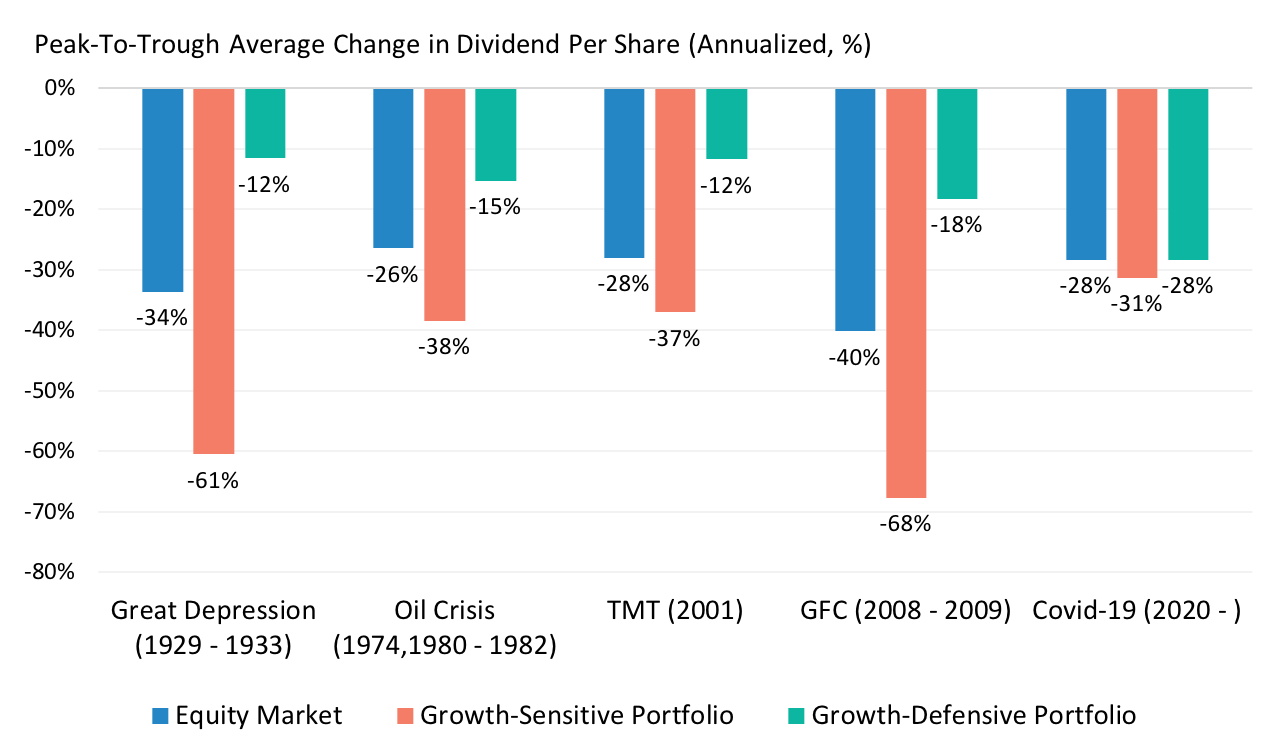
Exhibit 2 also shows that portfolios seem to differ in their payout sensitivity to large macro shocks. In all past crises, a growth-sensitive portfolio, with tilts towards small cap and value stocks, and consumer discretionary, industrials, materials, information technology, and financials sectors typically experienced larger declines in dividend per share compared to a growth-defensive portfolio, with tilts towards stocks with robust earnings and profitability, and consumer staples, utilities and healthcare sectors. However, the pandemic crisis seems different in this regard so far. Both growth-sensitive and growth-defensive portfolios experienced losses in dividends per share of similar magnitude. Deeper analyses revealed that in the last 6 months, payout gains experienced by the information technology sector - a major and heavy weight growth-sensitive sector - helped compensate the deep losses from small cap and value stocks and all other growth-sensitive sectors. Again, both the extent of the crisis and its duration remain uncertain to date. According to our models, a longer recovery time relative to our baseline scenario could lead to further severe losses in payouts .
Exhibits 1 and 2 suggest that large, persistent shocks leading to large increases in macro uncertainty are at the source of long-term, systematic return differentials across portfolios - through their impact on dividend payouts. More precisely, our macro-based models show that long-term return premia are compensation for the sensitivity of dividend per share to macro uncertainty, or "cash-flow beta". As a result, return premia also increase with macro uncertainty. Moreover, growth-sensitive portfolios, with higher cash-flow betas relative to the market, command higher expected returns in the long run in excess of the market, in compensation for greater payout losses in times of increasing macro uncertainty. Conversely, defensive portfolios, that exhibit lower cash-flow betas relative to market, command lower expected returns in the long run.
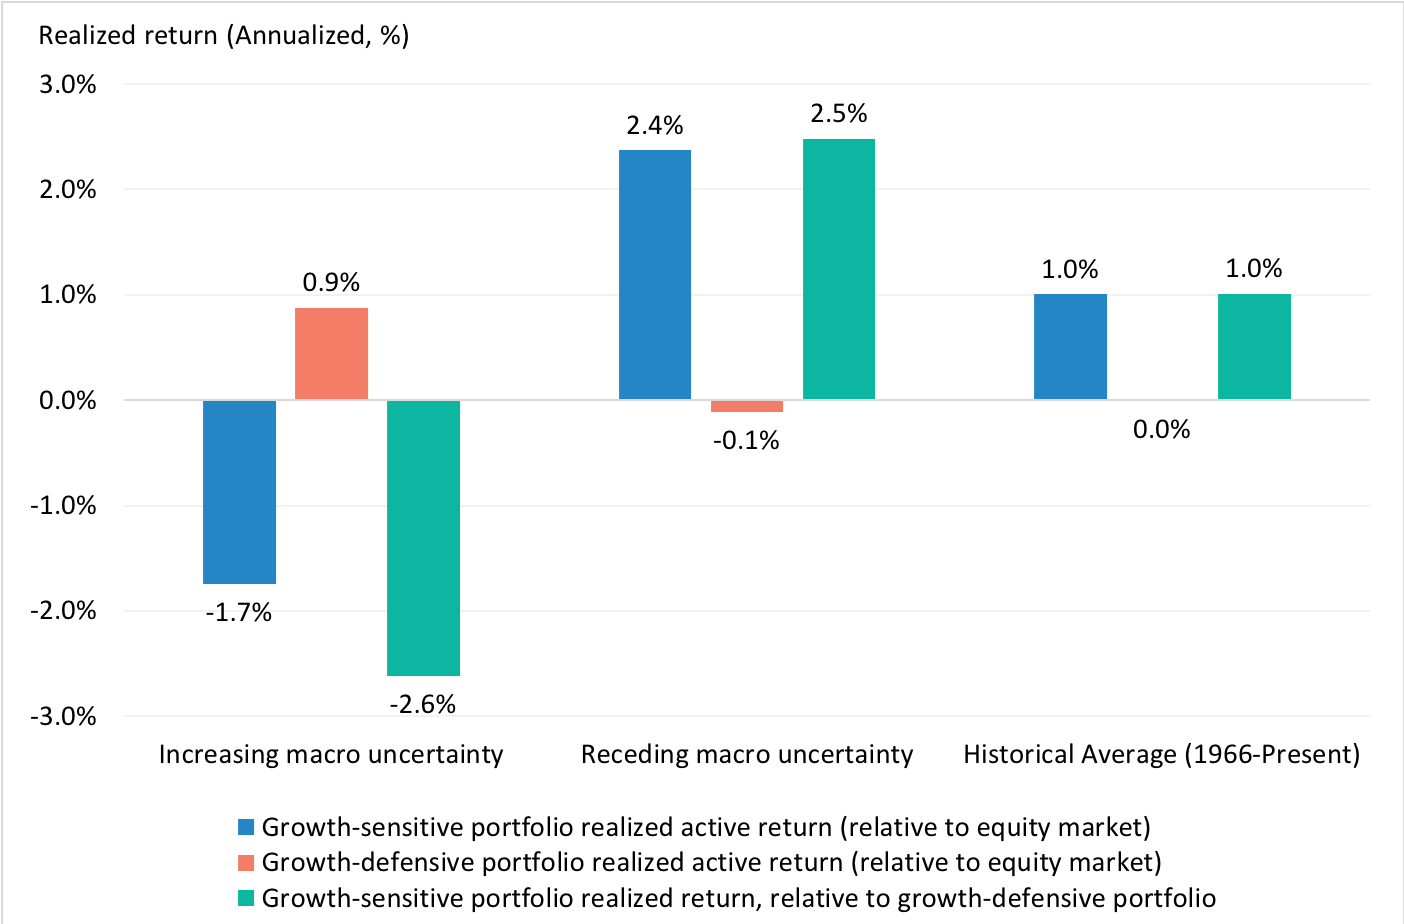
Exhibit 3 supports this fundamental relationship between macro uncertainty, cash-flow beta and return premia. Indeed, we find that the growth-sensitive portfolio outperformed the cap-weighted equity market on average over long periods (from January 1966 to present), while the defensive portfolio underperformed the market. In addition, the relative performance of growth-sensitive and defensive portfolios depended on changes in macro uncertainty. In our models, the growth-sensitive (defensive) portfolio underperformed (outperformed) on average when macro uncertainty rose, as in the decade that followed the GFC, and outperformed (underperformed) on average when macro uncertainty receded.
Where does this leave long-term investors? Going forward, a delayed economic recovery in the US driven by a resurgence in Covid-19 infections and inadequate policies (health and safety, fiscal, and monetary) could lead to a significant rise in macro uncertainty. In such a scenario, according to our models, corporate balance sheets could deteriorate further, shattering dividend payouts and realized equity returns. Moreover, in this scenario growth-defensive portfolios could outperform the equity market and growth-sensitive portfolios. In this context, long-term investors would be well-advised to re-examine their investment and savings decisions in view of potential changes in policy.
This document is for informational purposes only. This document is intended exclusively for the person to whom it has been delivered, and may not be reproduced or redistributed to any other person without the prior written consent of Navega Strategies LLC (“Navega”). The information contained herein is based on Nageva’s proprietary research analytics of data obtained from third party statistical services, company reports or communications, publicly available information, or other sources, believed to be reliable. However, Navega has not verified this information, and we make no representations whatsoever as to its accuracy or completeness. Navega does not intend to provide investment advice through this document. This document is in no way an offer to sell or a solicitation of an offer to buy any securities. Investing in securities involves risk of loss, including a loss of principal, that clients should be prepared to bear. Past performance is not indicative of future results, which may vary materially. While this summary highlights important data, it does not purport to capture all dimensions of risk. The methodology used to aggregate and analyze data may be adjusted periodically. The results of previous analyses may differ as a result of those adjustments. Navega has made assumptions that it deems reasonable and used the best information available in producing any calculations herein. Statements that are nonfactual in nature, including opinions, projections and estimates, assume certain economic conditions and industry developments and constitute only current opinions that could be incorrect and are subject to change without notice. All information provided herein is as of the delivery date the document (unless otherwise specified) and is subject to modification, change or supplement in the sole discretion of Navega without notice to you. This information is neither complete nor exact and is provided solely as reference material with respect to the services offered by Navega. Information throughout this document, whether stock quotes, charts, articles, or any other statement or statements regarding market or other financial information, is obtained from sources which we and our suppliers believe reliable, but we do not warrant or guarantee the timeliness or accuracy of this information. The information presented here has not been personalized, and is not based on the financial circumstances of the recipient. This information may not be applicable to your particular financial needs, and should not, by itself, be used to make determinations regarding the purchase or sale of securities, or other investment decisions.
The model performance information presented is based on the application of Navega’s factor analysis, backtested against actual historical data. “Backtesting” is a process of objectively simulating historical performance information by applying a set of rules backward in time. The results of the application of Navega’s model do not reflect actual performance or actual historical data. Such models are prepared with the full benefit of hindsight, and it is not likely that similar results could be achieved in the future.
The model portfolios were constructed by Navega with the benefit of hindsight to illustrate certain performance metrics. The performance shown was not actually achieved by any investor. The investments in these hypothetical portfolios were selected with the full benefit of hindsight, after performance over the period shown was known. It is not likely that similar results could not be achieved in the future. The hypothetical portfolios presented here are purely illustrative, and representative only of a small sample of possible scenarios.
The projections shown do not represent actual performance, and are based on assumptions which may not occur. It is possible that the markets will perform better or worse than shown in the projections, the actual results of an investor who invests in the manner these projections suggest will be better or worse than the projections, and an investor may lose money by relying on these projections.