Even as Covid-19 cases and fatalities seem to recede in most countries, investors still face uncertainties about the choice and effectiveness of policies that prepare for a tapering of restrictions on social and economic activity. According to our models, the primary consequence of these uncertainties is a rise in long-term risk premia - the expected long-term difference between equity market returns and 10-year government bond yields.
Uncertainties persist about the impact on long-term macroeconomic conditions of both the complexities of Covid-19 epidemiology, vaccine availability and the impact of health and safety restrictions together with fiscal and monetary easing already in place. As discussed in our previous pandemic related papers, scenario analyses that consistently trace the impact of policy choices on macro and market conditions can help investors grapple with these long-term uncertainties.
In this note we consider the following three policy driven scenarios for China and G7 countries and their implications for long-term economic growth and equity risk premium: a scenario consistent with our model baseline projections, a scenario leading to higher uncertainty about a lower long-term growth, and a worst case scenario that envisions a prolonged period of zero long-term growth. These scenarios are intended to illustrate one way to add some structure to discussions about the impact of Covid-19 policies on the economy and markets. Let's examine these scenarios in turn.
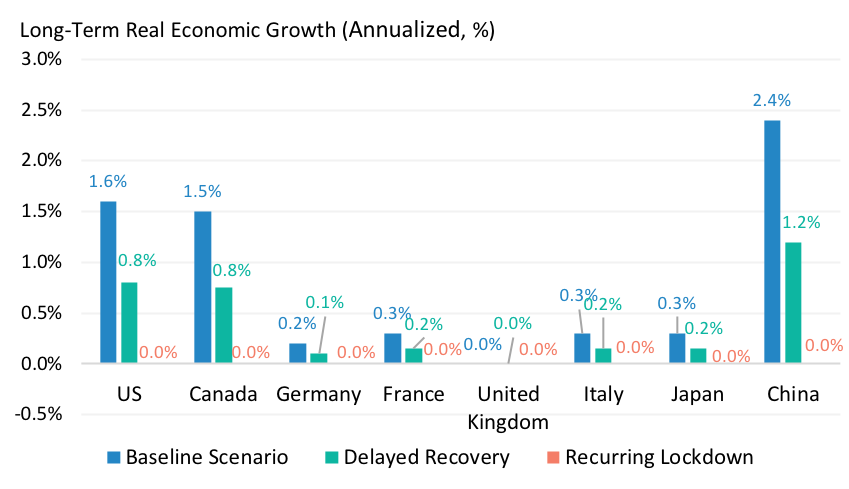
In this scenario, acceptable health and safety conditions including large scale testing and tracking capability, along with adequate treatment facilities allow an efficient and smooth tapering of social distancing and business restrictions. At the same time, targeted fiscal policies help mitigate impact on workers and businesses by compensating for loss in productivity. And targeted monetary policies mitigate impact on financing conditions (by extending credit lines to businesses for example). Moreover, this scenario also assumes investors believe an effective vaccine can be made widely available by year end. Exhibit 1 and Exhibit 2 show the scenarios implications for long-term real economic growth and growth uncertainty. Despite the extreme realized drop in real output in Q1 and a severe fall expected in Q2 by most analysts, our baseline assumption is that growth rates revert back within the next 12-18 months, leaving the long-term real economic growth trend and trend uncertainty mostly unchanged relative to our 2019 baseline model projections. In turn, as shown in Exhibit 3, according to our models, the long-term risk premium also remain unchanged.
Interestingly, the exhibits reveal that countries differed in their long-term macro conditions as they entered the crisis. In particular, with the exception of the US, and Canada, most G7 countries started the year with dismal prospects for long-term growth. And even though China fared better relative to G7, our models pointed to a long-term trend growth of 2.4%, far below reported past 5-year average rates of about 6.5%. In addition, major European countries and China faced high levels of long-term growth uncertainty. These differences in uncertainty across countries drove the broad dispersion in long-term equity risk premia across markets - from about 4.3% in the US, to about 6.3% in Europe and 9.0% in China.
This scenario assumes social and economic activity take longer time to recover as some level of social distancing and business restrictions are still required to maintain infections and fatalities to manageable levels, despite availability of testing and tracking, and adequate treatment facilities. Although advances in vaccine research and testing are promising, large scale availability is being delayed beyond year end, further increasing the odds of a second wave of rampant infections. Businesses and workers adapt to the new normal, but only slowly. While fiscal policies fail to provide enough compensation for continued loss in productivity, monetary policies still manage to limit the impact on financing conditions. As illustrated in Exhibit 1 and Exhibit 2, the likely longer term consequence for real output growth could be similar to the 2008 GFC experience, with a significant reduction in long-term trend growth overall and higher uncertainty for a prolonged period of time. In turn, according to Exhibit 3, risk premia increases across all countries, primarily driven by the rise in uncertainty.
In this disaster case, social distancing measures are relaxed too early, while conditions to allow smooth transition to return to normal are still far from being met, with a resurgence of infections and low expectations of vaccine availability. As a result, policies are unable to contain the dire impact on health and the real economy, increasing the odds of recurrent lockdowns. And even worse, they fail to provide clarity on next steps, leading to a loss of confidence and economic paralysis. To set ideas, we modeled this scenario after the great depression experience: a prolonged period of economic disruption leading to near zero growth in long-term real GDP, as illustrated in Exhibit 1. Calibrating our models to this scenario leads to a further rise in long-term uncertainty, as depicted in Exhibit 2. As a consequence, Exhibit 3 shows that equity risk premia are projected by our models to increase to as much as 7.7% in the US and Japan, about 8.8% in Europe, and up to 10.3% in China. Relative to our baseline scenario, these rises in long-term risk premia are consistent with depressed equity market values at 50% from 2019 levels that could take a long time to recover.
As the level of uncertainty around pandemic policy and policy responses still remains high, we would suggest that investors continue monitor signals to changes in common knowledge of Covid-19 epidemiology, policy choices, and their impact on health conditions and the drivers of long-term growth and inflation. Collective intelligence, integrated with our macro-based models can further help inform these changes and refine scenarios along with their likelihood. Subsequent notes will remain sensitive to material changes in perception, and update scenarios and their implications for returns, yields and portfolio decisions.


This document is for informational purposes only. This document is intended exclusively for the person to whom it has been delivered, and may not be reproduced or redistributed to any other person without the prior written consent of Navega Strategies LLC (“Navega”). The information contained herein is based on Nageva’s proprietary research analytics of data obtained from third party statistical services, company reports or communications, publicly available information, or other sources, believed to be reliable. However, Navega has not verified this information, and we make no representations whatsoever as to its accuracy or completeness. Navega does not intend to provide investment advice through this document. This document is in no way an offer to sell or a solicitation of an offer to buy any securities. Investing in securities involves risk of loss, including a loss of principal, that clients should be prepared to bear. Past performance is not indicative of future results, which may vary materially. While this summary highlights important data, it does not purport to capture all dimensions of risk. The methodology used to aggregate and analyze data may be adjusted periodically. The results of previous analyses may differ as a result of those adjustments. Navega has made assumptions that it deems reasonable and used the best information available in producing any calculations herein. Statements that are nonfactual in nature, including opinions, projections and estimates, assume certain economic conditions and industry developments and constitute only current opinions that could be incorrect and are subject to change without notice. All information provided herein is as of the delivery date the document (unless otherwise specified) and is subject to modification, change or supplement in the sole discretion of Navega without notice to you. This information is neither complete nor exact and is provided solely as reference material with respect to the services offered by Navega. Information throughout this document, whether stock quotes, charts, articles, or any other statement or statements regarding market or other financial information, is obtained from sources which we and our suppliers believe reliable, but we do not warrant or guarantee the timeliness or accuracy of this information. The information presented here has not been personalized, and is not based on the financial circumstances of the recipient. This information may not be applicable to your particular financial needs, and should not, by itself, be used to make determinations regarding the purchase or sale of securities, or other investment decisions.
The model performance information presented is based on the application of Navega’s factor analysis, backtested against actual historical data. “Backtesting” is a process of objectively simulating historical performance information by applying a set of rules backward in time. The results of the application of Navega’s model do not reflect actual performance or actual historical data. Such models are prepared with the full benefit of hindsight, and it is not likely that similar results could be achieved in the future.
The model portfolios were constructed by Navega with the benefit of hindsight to illustrate certain performance metrics. The performance shown was not actually achieved by any investor. The investments in these hypothetical portfolios were selected with the full benefit of hindsight, after performance over the period shown was known. It is not likely that similar results could not be achieved in the future. The hypothetical portfolios presented here are purely illustrative, and representative only of a small sample of possible scenarios.
The projections shown do not represent actual performance, and are based on assumptions which may not occur. It is possible that the markets will perform better or worse than shown in the projections, the actual results of an investor who invests in the manner these projections suggest will be better or worse than the projections, and an investor may lose money by relying on these projections.