While timing markets can be challenging , a key issue for investors who care about long horizons is whether they can benefit from changes in the macroeconomic and market environment. Our models indicate that they can - in the long run - by aligning allocations to risk premia away from cap-weighted equities with changes in macro uncertainty. In doing so, investors are well advised to explore alternative investment opportunities to source risk premia - at low costs - and to mitigate the impact of turnover and capacity constraints.
Our previous papers defined macro uncertainty as markets’ valuation of potential persistent, negative shocks to long-term trend growth. Long run return premium is compensation for exposure to macro uncertainty. Factors and sectors are growth-sensitive, with higher exposure to uncertainty compared to market, or defensive, with lower exposure . Thus according to our models, long horizon investors, who can better withstand large negative macro shocks (such as institutions or investors in their early to mid-working life) should consider strategically tilting toward growth-sensitive factors and sectors. Conversely, investors with shorter horizons and low tolerance for uncertainty (late working life individuals or retirees for example) should rather consider strategic tilts towards growth-defensive factors and sectors .
However, macro uncertainty does change over time. In tandem, so do asset return premia, with differences across assets. Growth-sensitive factor and sector premia increase with uncertainty, while defensive premia decrease . In turn, to harvest factor and sector premia in the long run, our models dictate that long run investors align allocations with changes in uncertainty, possibly deviating from their strategic positions. More precisely, in the case of long run investors, our models indicate that relative allocations to growth-sensitive factors and sectors increase (decrease) with increases (decreases) in uncertainty. And conversely, in the case of investors with low tolerance for investors, the net growth-defensive factor and sector allocations increase (decrease) with increases (decreases) in uncertainty .
What about in practice? Do these uncertainty-driven factor and sector allocation shifts benefit long run investors? To address this issue, we backtested the performance of three strategies. The first strategy, standing as our reference portfolio, rebalances (quarterly) to the fixed 70-30 US cap-weighted equity market and US 10-year duration government bonds split. The second strategy rebalances (quarterly) to the same 30% allocation to bonds, but deviates from the cap-weighted equity market by strategically tilting towards fixed allocations to US growth-sensitive factors and sectors. Finally, the third strategy dynamically tilts the relative growth-sensitive allocations to factors and sectors with quarterly changes in our US macro uncertainty index, while rebalancing (quarterly) to the same fixed 30% allocation to bonds.
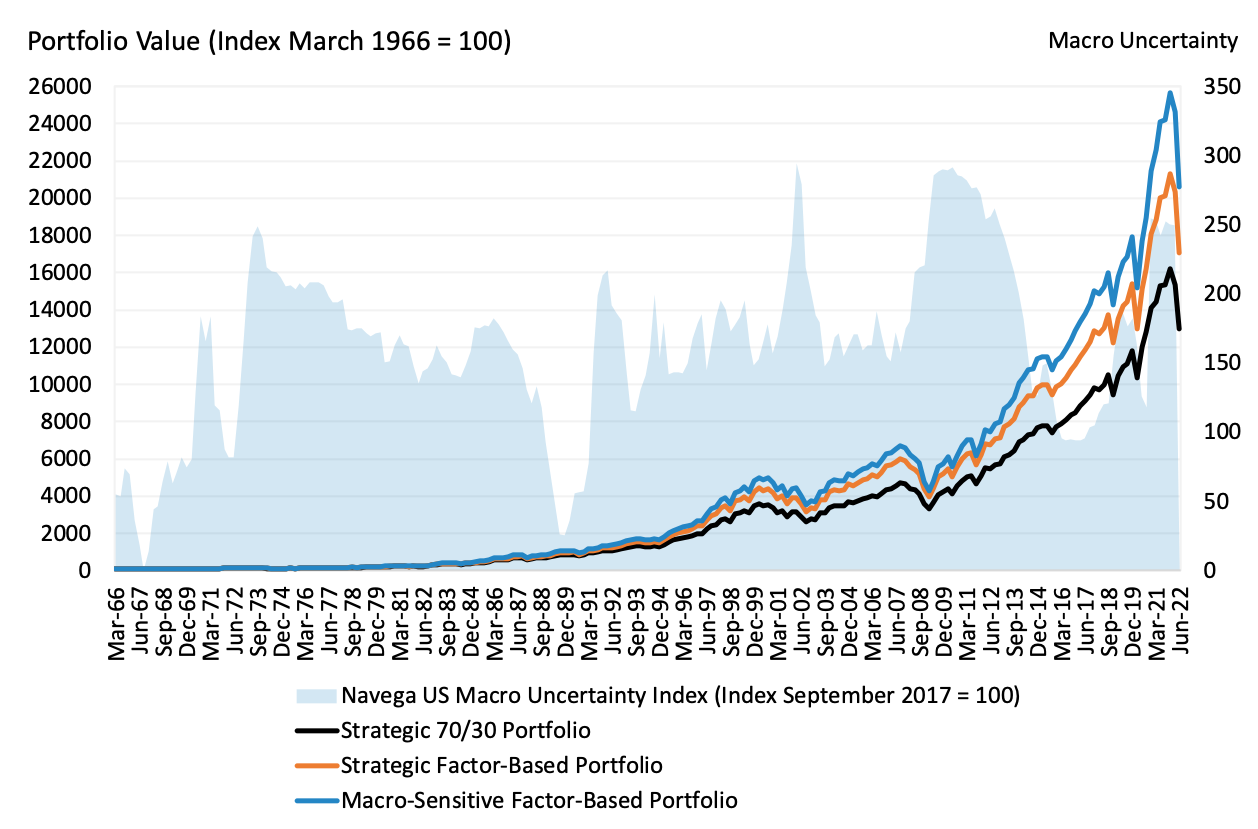
Exhibit 1 depicts the cumulative return to each strategy and the evolution of the Navega US macro uncertainty index from January 1966 through June 2022. For the specific long horizon investor and the historical sample period considered in the analysis, the principle conclusions are that the actual experience has been well aligned with our models' predictions:
The strategic growth-sensitive portfolio outperformed the portfolio rebalancing to the cap-weighted equity market - growth-sensitive premia reflect compensation for greater exposure to macro uncertainty.
The dynamic, macro-sensitive portfolio outperformed the growth-sensitive portfolio, especially during periods of receding macro uncertainty.
The macro-sensitive portfolio underperformed (both the strategic growth-sensitive and 70/30 portfolios) during times of large increases in macro uncertainty.

More precisely, Exhibit 2 summarises the average return and volatility characteristics of each strategy over the entire sample period. On average from January 1966 to June 2022, relative to rebalancing to cap-weighted equities, strategically tilting to growth-sensitive factors and sectors added about 60bps per year. Non-surprisingly, this positive net growth-sensitive exposure also increased volatility, from 12.7% to 13.5%. However the strategic growth-sensitive factor (and sector) based portfolio achieved a higher Sharpe ratio (29.5%) relative to the 70/30 strategy (27.1%). Dynamically aligning the growth-sensitive tilts with changes in macro uncertainty further added about 50bps per year, on average over the same period, relative to the strategic growth-sensitive portfolio. This macro-sensitive factor-based strategy also resulted in a slightly higher Sharpe ratio (31.1%), despite the increase in volatility (14.5%).
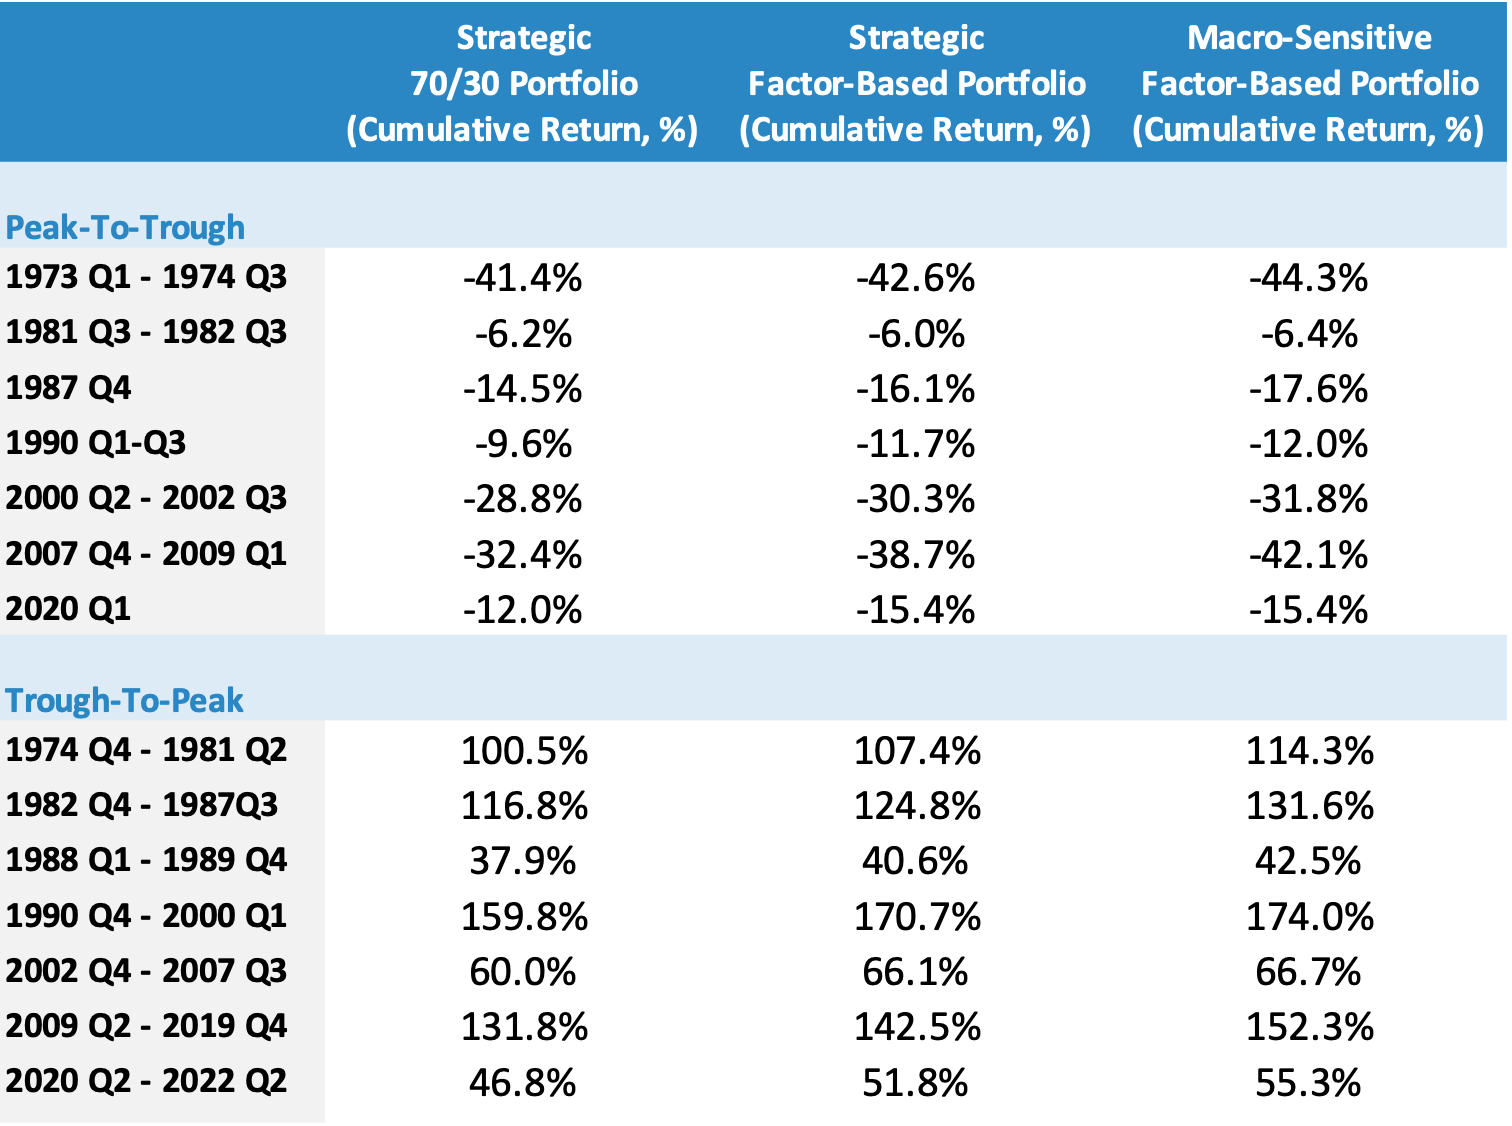
Let's examine the sources of the relative outperformance of the dynamic macro-sensitive strategy. Exhibit 3 compares peak-to-trough and trough-to-peak (extended recovery) realised returns to the strategies. For the most part, the peak-to-trough periods were consistent with increases in macro uncertainty, as measured by our models. While the trough-to-peak periods were consistent with receding macro uncertainty. As predicted by our models, the dynamic macro-sensitive portfolio experienced relatively larger peak-to-trough declines, reflecting the increased exposure to growth-sensitive factors and sectors through these periods. However, these losses were more than compensated for by larger trough-to-peak gains, as macro uncertainty receded. Moreover, the larger the decrease (increase) in macro uncertainty, the greater the benefits (losses).
The main takeaway from this analysis is that the long run performance of investment portfolios is primarily driven by large, negative and persistent shocks to real economic growth. In turn, long run investors should be well advised to align their strategic allocations, away from cap-weighted market equities to growth-sensitive factors and sectors, with their tolerance for macro uncertainty. In addition, long run investors could also benefit from dynamically aligning their growth-sensitive (and defensive) allocations with changes in macro uncertainty - possibly extending investment opportunities to other asset types. Said differently, while short-term market timing is challenging, valuing and hedging macro uncertainty does matter in the long run, in theory and in practice.
This document is for informational purposes only. This document is intended exclusively for the person to whom it has been delivered, and may not be reproduced or redistributed to any other person without the prior written consent of Navega Strategies LLC (“Navega”). The information contained herein is based on Nageva’s proprietary research analytics of data obtained from third party statistical services, company reports or communications, publicly available information, or other sources, believed to be reliable. However, Navega has not verified this information, and we make no representations whatsoever as to its accuracy or completeness. Navega does not intend to provide investment advice through this document. This document is in no way an offer to sell or a solicitation of an offer to buy any securities. Investing in securities involves risk of loss, including a loss of principal, that clients should be prepared to bear. Past performance is not indicative of future results, which may vary materially. While this summary highlights important data, it does not purport to capture all dimensions of risk. The methodology used to aggregate and analyze data may be adjusted periodically. The results of previous analyses may differ as a result of those adjustments. Navega has made assumptions that it deems reasonable and used the best information available in producing any calculations herein. Statements that are nonfactual in nature, including opinions, projections and estimates, assume certain economic conditions and industry developments and constitute only current opinions that could be incorrect and are subject to change without notice. All information provided herein is as of the delivery date the document (unless otherwise specified) and is subject to modification, change or supplement in the sole discretion of Navega without notice to you. This information is neither complete nor exact and is provided solely as reference material with respect to the services offered by Navega. Information throughout this document, whether stock quotes, charts, articles, or any other statement or statements regarding market or other financial information, is obtained from sources which we and our suppliers believe reliable, but we do not warrant or guarantee the timeliness or accuracy of this information. The information presented here has not been personalized, and is not based on the financial circumstances of the recipient. This information may not be applicable to your particular financial needs, and should not, by itself, be used to make determinations regarding the purchase or sale of securities, or other investment decisions.
The model performance information presented is based on the application of Navega’s factor analysis, backtested against actual historical data. “Backtesting” is a process of objectively simulating historical performance information by applying a set of rules backward in time. The results of the application of Navega’s model do not reflect actual performance or actual historical data. Such models are prepared with the full benefit of hindsight, and it is not likely that similar results could be achieved in the future.
The model portfolios were constructed by Navega with the benefit of hindsight to illustrate certain performance metrics. The performance shown was not actually achieved by any investor. The investments in these hypothetical portfolios were selected with the full benefit of hindsight, after performance over the period shown was known. It is not likely that similar results could not be achieved in the future. The hypothetical portfolios presented here are purely illustrative, and representative only of a small sample of possible scenarios.
The projections shown do not represent actual performance, and are based on assumptions which may not occur. It is possible that the markets will perform better or worse than shown in the projections, the actual results of an investor who invests in the manner these projections suggest will be better or worse than the projections, and an investor may lose money by relying on these projections.