After four quarters of strong real GDP growth, investors may be lulled into thinking that we’re in for a period of sustained high real economic growth. Our models suggest that while the short-term recovery from the pandemic is certainly welcome news, there are good reasons for investors to brace for long-term real growth that continues to be below its historical (pre-2008 GFC) average. Moreover, uncertainty about the sustainability of the recent real growth spurt continues to be quite high. It is this macro-growth uncertainty that is important for long-term asset returns.
Our earlier note Long-Term Inflation Risk Has Increased argued that investors should focus on the drivers of long-term growth and growth uncertainty rather than obsessing over short-term data releases. In this line of reasoning, the central questions for investors concerned about long-term asset returns are:
What are the likely post-pandemic trend real growth rates?
How long could it take for economies to recover those rates (i.e. what’s the range of uncertainty)? And,
What are the drivers of long-term growth uncertainty?
We start by addressing the first two questions. Exhibit 1 shows our model’s projections for long-term real growth and growth uncertainty for the US, UK, Japan, China, Eurozone , DM , and EM countries pre-pandemic and as of July 31st.
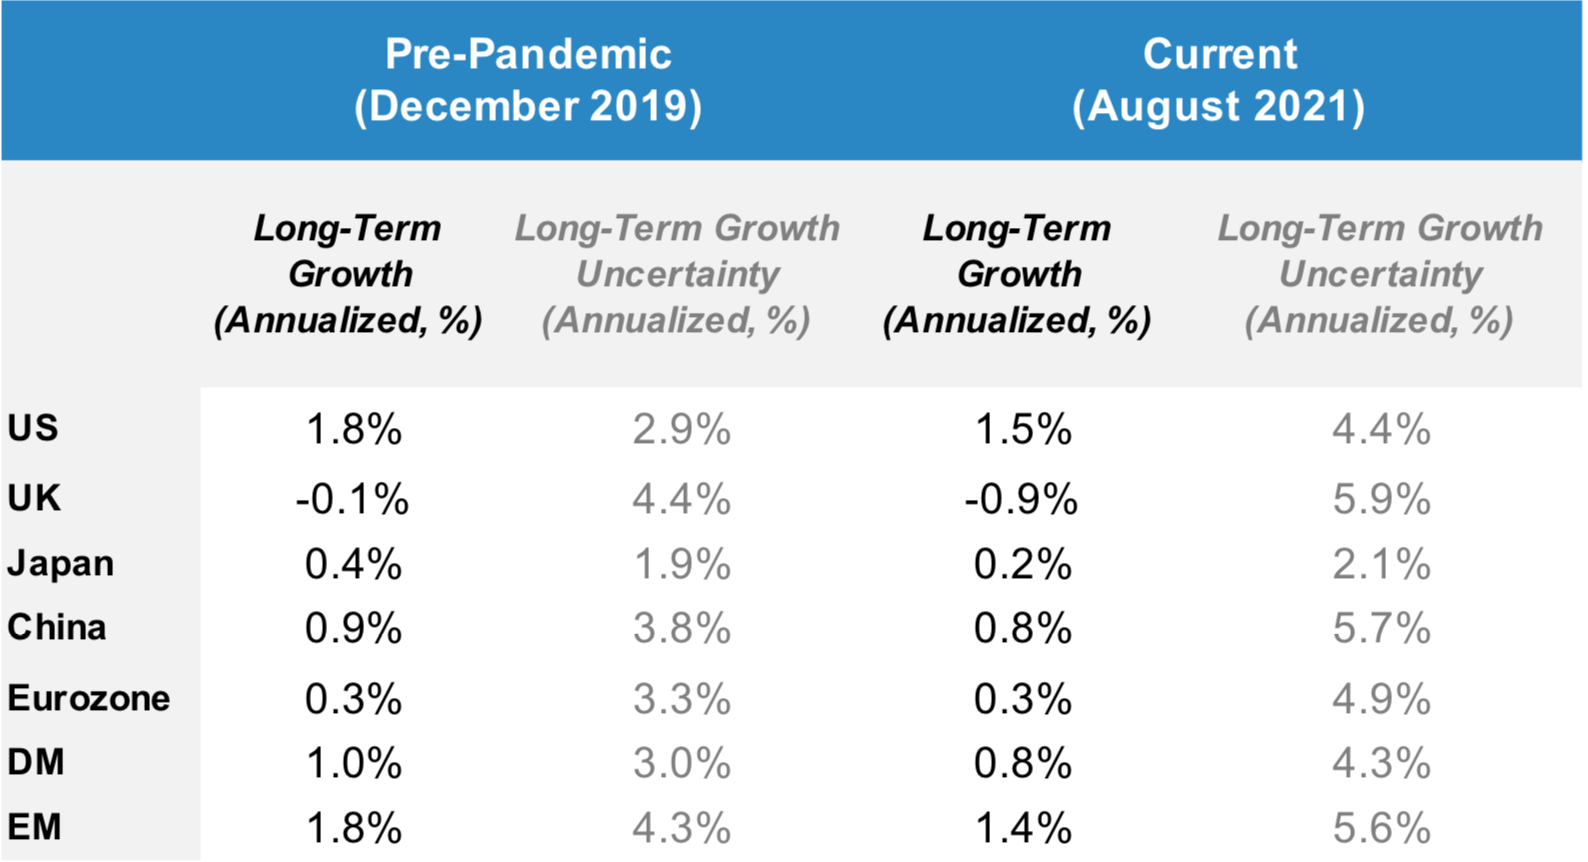
There are three clear takeaways from this Exhibit. First, according to our models, the post-pandemic long-term trend real growth rates are likely to stagnate at their current low level in the case the Eurozone, or at even lower levels compared to pre-pandemic trends for all other countries. Second, long-term uncertainty has increased significantly, and is back to levels experienced during the 2008 global financial crisis. This means that the economic recovery - to lower post-pandemic trend growth rates – could be delayed. Finally, there are noticeable differences across countries’ long-term growth prospects.
Notably, the US is the likely long-run winner relative to the UK, Eurozone, Japan and even China, as controversial it may seem. Official statistics for China suggest that the Chinese economy was growing at about 6% pre-pandemic, and that growth rates seem to have nearly fully recovered. By contrast, our models suggest China’s trend growth was about 0.9% pre-pandemic (as of December 2019), and has now likely declined to 0.8%. Several more timely and reliable indicators - such as industrial production growth and interest rate levels - seem to support this contrasting view on China’s growth prospects.
These observations all beg the next key question: what are the sources of these lower real economic growth trends and higher uncertainties? Our models point to two main drivers: labor force growth and total factor productivity (TFP) growth . Let’s examine these in sequence.
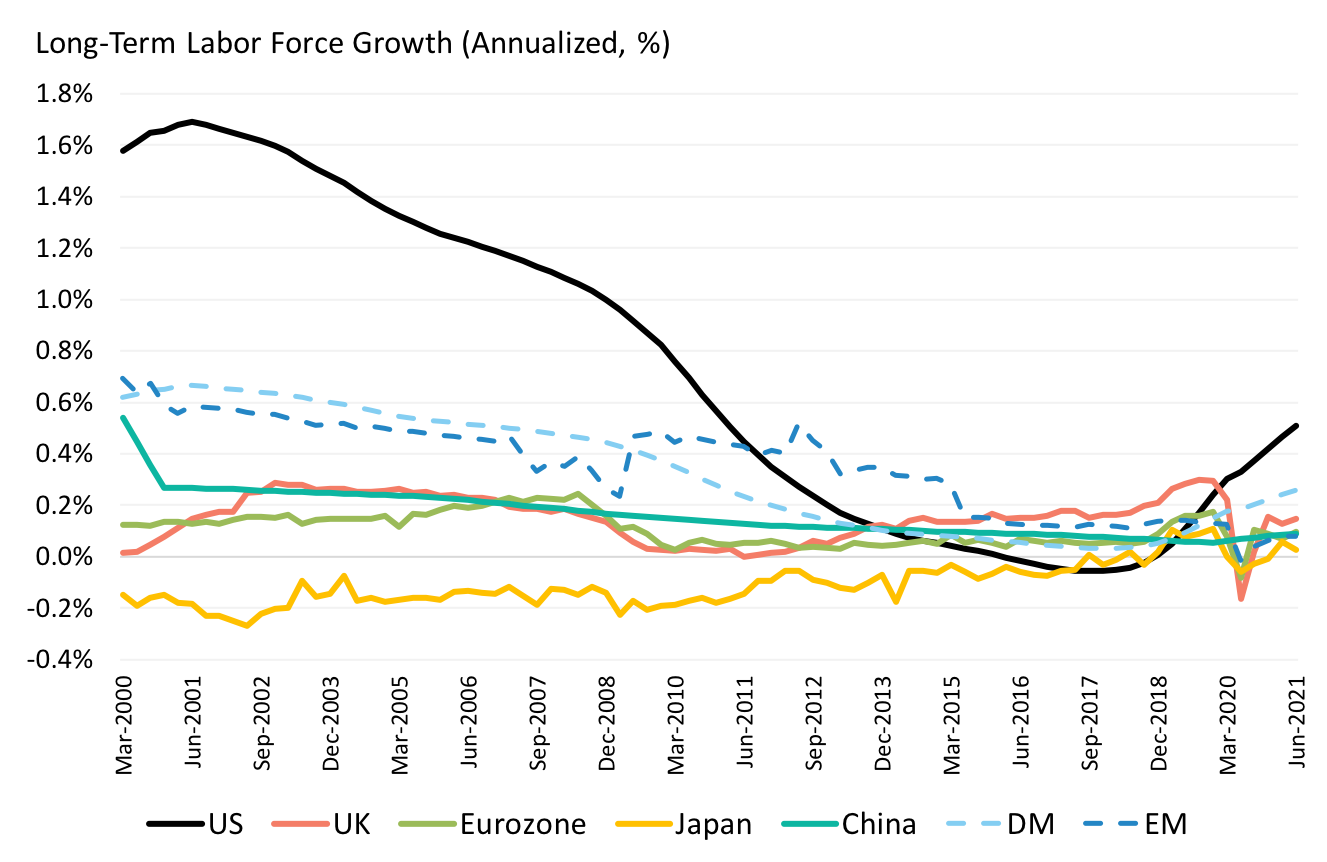
Exhibit 2 portrays the evolutions of long-term changes in total hours worked - our measure of labor force trend growth - for the same major countries and regions. The trends are striking: since roughly 2000, growth in the labor force has been stagnating at near zero levels or declining on trend, driven in part by the relative decline in younger workers in aging populations. This downward trend clearly predates the pandemic. Moreover, these demographic trends are also quite predictable overall, with relatively small levels of uncertainty compared to real economic growth rates. Although labor force growth across these countries has declined secularly, Exhibit 2 suggests that recent trends in the US are more favorable than the rest of the world .
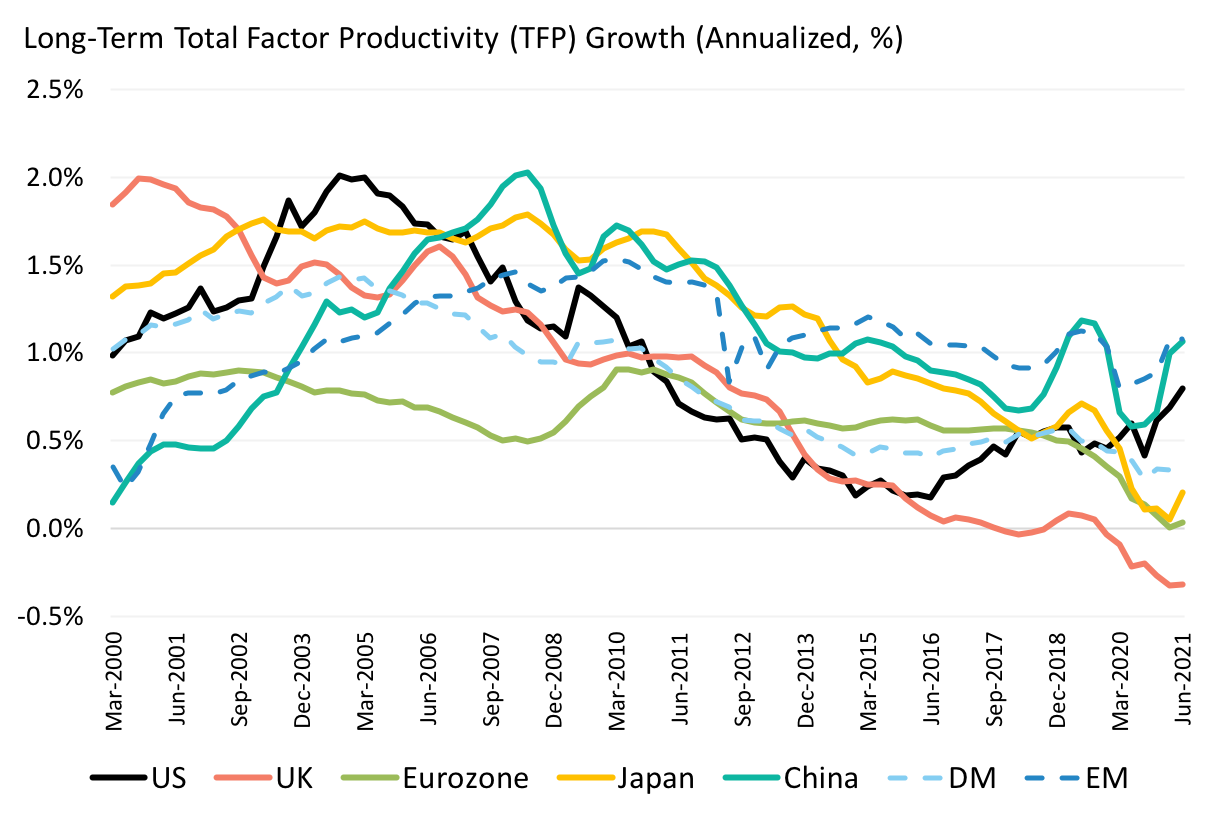
What about TFP? Exhibit 3 depicts the evolution of long-term real (inflation-adjusted) TFP growth trends, as measured by our models. Again, the direction of the trends is striking. Long-term TFP growth has been declining on trend since the late 1990s, also predating the pandemic! (It is worth noting that recent trends in TFP growth favor the US). By contrast to the changes in the labor force, TFP growth rates embed a much higher degree of uncertainty. In other words, the bulk of long-term real economic growth uncertainty can be attributed to uncertainty in real TFP growth . Thus, it is worth digging deeper into the potential drivers of TFP growth itself and TFP growth risk .
These results carry important implications for investors. First, and to reiterate, investors should pay attention to the long-term trend in real economic growth, the uncertainty about this trend, and carefully examine the sources of this uncertainty. Second, our analyses so far suggest that there are clear limits on long-term prospects for growth, driven by secular trends in demographics and TFP growth, that are unlikely to dissipate anytime soon. And third, growth expectations and uncertainty are reflected in markets’ pricing of bonds and risky assets and investors’ portfolio strategies. We will explore the implications for bond yields and risk premia, and portfolio strategies in subsequent notes.
This document is for informational purposes only. This document is intended exclusively for the person to whom it has been delivered, and may not be reproduced or redistributed to any other person without the prior written consent of Navega Strategies LLC (“Navega”). The information contained herein is based on Nageva’s proprietary research analytics of data obtained from third party statistical services, company reports or communications, publicly available information, or other sources, believed to be reliable. However, Navega has not verified this information, and we make no representations whatsoever as to its accuracy or completeness. Navega does not intend to provide investment advice through this document. This document is in no way an offer to sell or a solicitation of an offer to buy any securities. Investing in securities involves risk of loss, including a loss of principal, that clients should be prepared to bear. Past performance is not indicative of future results, which may vary materially. While this summary highlights important data, it does not purport to capture all dimensions of risk. The methodology used to aggregate and analyze data may be adjusted periodically. The results of previous analyses may differ as a result of those adjustments. Navega has made assumptions that it deems reasonable and used the best information available in producing any calculations herein. Statements that are nonfactual in nature, including opinions, projections and estimates, assume certain economic conditions and industry developments and constitute only current opinions that could be incorrect and are subject to change without notice. All information provided herein is as of the delivery date the document (unless otherwise specified) and is subject to modification, change or supplement in the sole discretion of Navega without notice to you. This information is neither complete nor exact and is provided solely as reference material with respect to the services offered by Navega. Information throughout this document, whether stock quotes, charts, articles, or any other statement or statements regarding market or other financial information, is obtained from sources which we and our suppliers believe reliable, but we do not warrant or guarantee the timeliness or accuracy of this information. The information presented here has not been personalized, and is not based on the financial circumstances of the recipient. This information may not be applicable to your particular financial needs, and should not, by itself, be used to make determinations regarding the purchase or sale of securities, or other investment decisions.
The model performance information presented is based on the application of Navega’s factor analysis, backtested against actual historical data. “Backtesting” is a process of objectively simulating historical performance information by applying a set of rules backward in time. The results of the application of Navega’s model do not reflect actual performance or actual historical data. Such models are prepared with the full benefit of hindsight, and it is not likely that similar results could be achieved in the future.
The model portfolios were constructed by Navega with the benefit of hindsight to illustrate certain performance metrics. The performance shown was not actually achieved by any investor. The investments in these hypothetical portfolios were selected with the full benefit of hindsight, after performance over the period shown was known. It is not likely that similar results could not be achieved in the future. The hypothetical portfolios presented here are purely illustrative, and representative only of a small sample of possible scenarios.
The projections shown do not represent actual performance, and are based on assumptions which may not occur. It is possible that the markets will perform better or worse than shown in the projections, the actual results of an investor who invests in the manner these projections suggest will be better or worse than the projections, and an investor may lose money by relying on these projections.