Our earlier note provided some context for evaluating inflation expectations and cautioned against reacting to short term data releases. That said, our models suggest that US inflation risk has increased, even if expected inflation levels haven’t changed that much when compared to pre-pandemic levels. Two factors lead to this conclusion: first, our prior for long-term real growth in the US has decreased, both in absolute terms and relative to the rest of the world; second, our models indicate that US real growth risk has increased, both in absolute terms and relative to the rest of the world.
Basic government budget considerations link expected inflation levels to the expected levels of net government debt creation (including growth in the monetary base and fiscal surpluses, primarily revenues from taxes). All else equal, higher expected levels of government debt creation over time relative to expectations of future surpluses lead to higher levels of expected inflation today. What matters in this formulation is the expected path of debt creation and whether it can be backed by potential future surpluses (i.e. future real economic growth), not single episodic bursts of new debt.
This point provides context for evaluating the explosive pandemic-induced rise in the US debt-to-gdp ratio, shown in Exhibit 1. The striking increase in debt is what has many investors pondering the question of inflation risk. Our point of view is that this question is closely tied to the path for real growth and real growth uncertainty.

We can, of course, work out the basic government accounting relationship from a different perspective. Suppose that we hold the expected growth rate of net debt creation constant but instead increase real economic growth. In this case, the path for the ratio of debt to gdp decreases and the expected inflation rate decreases. On balance then, today’s expected inflation rate depends on the expected real growth rate (and growth uncertainty) and the expected growth in the debt-to-gdp ratio. By extension, the risk of inflation would depend on the long-term real growth uncertainty, the volatility of the debt-to-gdp ratio, and the (negative) correlation between debt-to-gdp and GDP.
For the US, there is one more wrinkle to add. A recent FT article pointed out that over the past 75 years the USD has been the world’s primary reserve currency. This role has meant that USD-denominated debt has been held by both US and non-US investors. One of the many reasons that non-US investors would hold US dollar denominated debt assets is because of their perceived safety, especially in bad economic times. In turn, this perception of safety is anchored on the perception of the economic position of the US in the world: US real growth rates are expected to be higher than non-US real growth rates. So, for the US, inflation risk also depends on changes in expected real growth and real growth uncertainty relative to the rest of the world.

So what’s been happening with real growth and real growth uncertainty in the US, especially relative to the rest of the world? Exhibit 2 plots since 1997, the evolution of our real growth prior for the US versus the rest of the world, and the evolution of the US relative growth uncertainty (measured as the probability that long-term growth in the rest of the world exceeds that of the US). As is evident from the exhibit, real growth in the US is expected to exceed real growth in the rest of the world, but not by as much as pre-pandemic. At the same time, US relative growth uncertainty has increased, driven by the pandemic-induced increase in US real GDP growth uncertainty. As a consequence of both of these trends, weakening the US net external debt position, US inflation risk has increased.
Exhibit 3 plots the evolution of US inflation risk since 1997. The exhibit also plots the contribution to US inflation risk from increases in the US net external debt position. As is evident from the exhibit, today’s levels of inflation risk have increased relative to their pre-pandemic levels, and are back where they were in the period following the GFC. Moreover, the percentage of US inflation risk attributable to reserve currency considerations has also increased, both on trend in the last 20 years and compared to pre-pandemic rates.
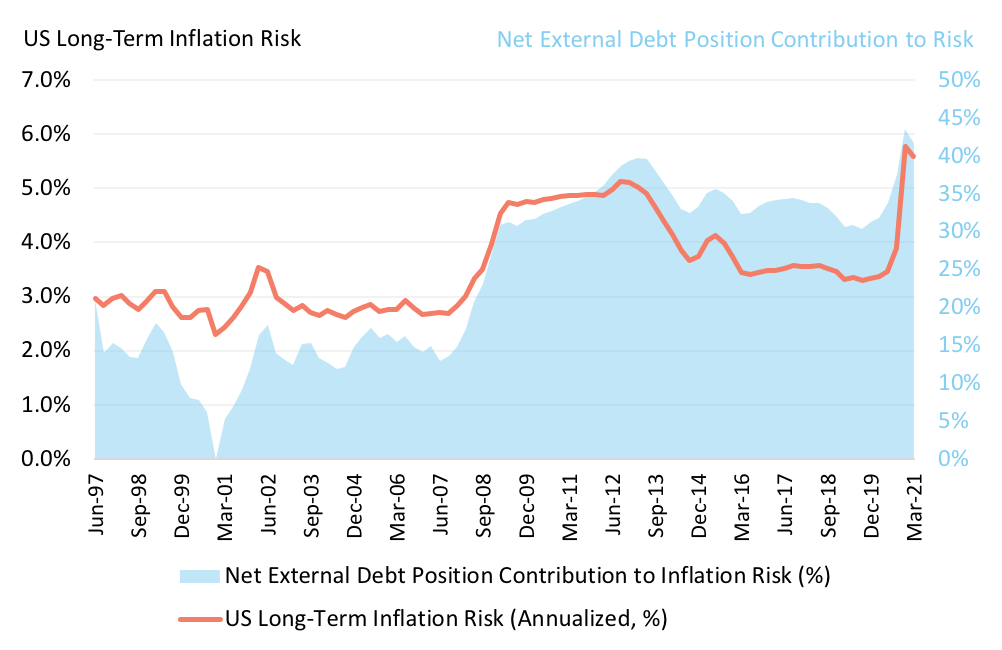
To be clear: Exhibit 3 gives information only about the range of outcomes that could happen - it contains no information about when or if inflation (both levels and expectations) will change. That said, past experience (in the 1970s, for example) indicates that significant and abrupt changes in inflation expectations can occur. Because these turning points are unpredictable - akin to bank runs - investors would be well-advised to focus on expectations for US long-term real growth (both absolute and relative) and US long-term real growth uncertainty (and both absolute and relative).
This document is for informational purposes only. This document is intended exclusively for the person to whom it has been delivered, and may not be reproduced or redistributed to any other person without the prior written consent of Navega Strategies LLC (“Navega”). The information contained herein is based on Nageva’s proprietary research analytics of data obtained from third party statistical services, company reports or communications, publicly available information, or other sources, believed to be reliable. However, Navega has not verified this information, and we make no representations whatsoever as to its accuracy or completeness. Navega does not intend to provide investment advice through this document. This document is in no way an offer to sell or a solicitation of an offer to buy any securities. Investing in securities involves risk of loss, including a loss of principal, that clients should be prepared to bear. Past performance is not indicative of future results, which may vary materially. While this summary highlights important data, it does not purport to capture all dimensions of risk. The methodology used to aggregate and analyze data may be adjusted periodically. The results of previous analyses may differ as a result of those adjustments. Navega has made assumptions that it deems reasonable and used the best information available in producing any calculations herein. Statements that are nonfactual in nature, including opinions, projections and estimates, assume certain economic conditions and industry developments and constitute only current opinions that could be incorrect and are subject to change without notice. All information provided herein is as of the delivery date the document (unless otherwise specified) and is subject to modification, change or supplement in the sole discretion of Navega without notice to you. This information is neither complete nor exact and is provided solely as reference material with respect to the services offered by Navega. Information throughout this document, whether stock quotes, charts, articles, or any other statement or statements regarding market or other financial information, is obtained from sources which we and our suppliers believe reliable, but we do not warrant or guarantee the timeliness or accuracy of this information. The information presented here has not been personalized, and is not based on the financial circumstances of the recipient. This information may not be applicable to your particular financial needs, and should not, by itself, be used to make determinations regarding the purchase or sale of securities, or other investment decisions.
The model performance information presented is based on the application of Navega’s factor analysis, backtested against actual historical data. “Backtesting” is a process of objectively simulating historical performance information by applying a set of rules backward in time. The results of the application of Navega’s model do not reflect actual performance or actual historical data. Such models are prepared with the full benefit of hindsight, and it is not likely that similar results could be achieved in the future.
The model portfolios were constructed by Navega with the benefit of hindsight to illustrate certain performance metrics. The performance shown was not actually achieved by any investor. The investments in these hypothetical portfolios were selected with the full benefit of hindsight, after performance over the period shown was known. It is not likely that similar results could not be achieved in the future. The hypothetical portfolios presented here are purely illustrative, and representative only of a small sample of possible scenarios.
The projections shown do not represent actual performance, and are based on assumptions which may not occur. It is possible that the markets will perform better or worse than shown in the projections, the actual results of an investor who invests in the manner these projections suggest will be better or worse than the projections, and an investor may lose money by relying on these projections.