Although inflation was significantly down at 6.4% (year-on-year) in January from its June 2022 peak of 9.1%, the slow pace of the decline continues to fuel uncertainty about the path of future monetary policy, and its ability to tame future price increases in a context of rising wages and stronger labor markets. In our view, recent analyses drawing on the 1970s wage-price spiral experience are misconstrued and do not serve investors nor policy makers well. First, they ignore short-term supply-side drivers of inflation . And secondly, they ignore the Federal Reserve's explicit and only mandates of maximum employment and price stability, over time. Hence the key question for investors is whether the Fed's 2% target for long-term inflation is credible or not. Instead of obsessing on recent realised inflation figures, investors are better advised to focus on long-term expectations of inflation and their drivers. Accordingly, our models suggest that both the recent trends in bond markets and government finances (declining debt-to-gdp ratio) are consistent with a long-term inflation expectation of 1.8% - a rate about the Fed's target rate.
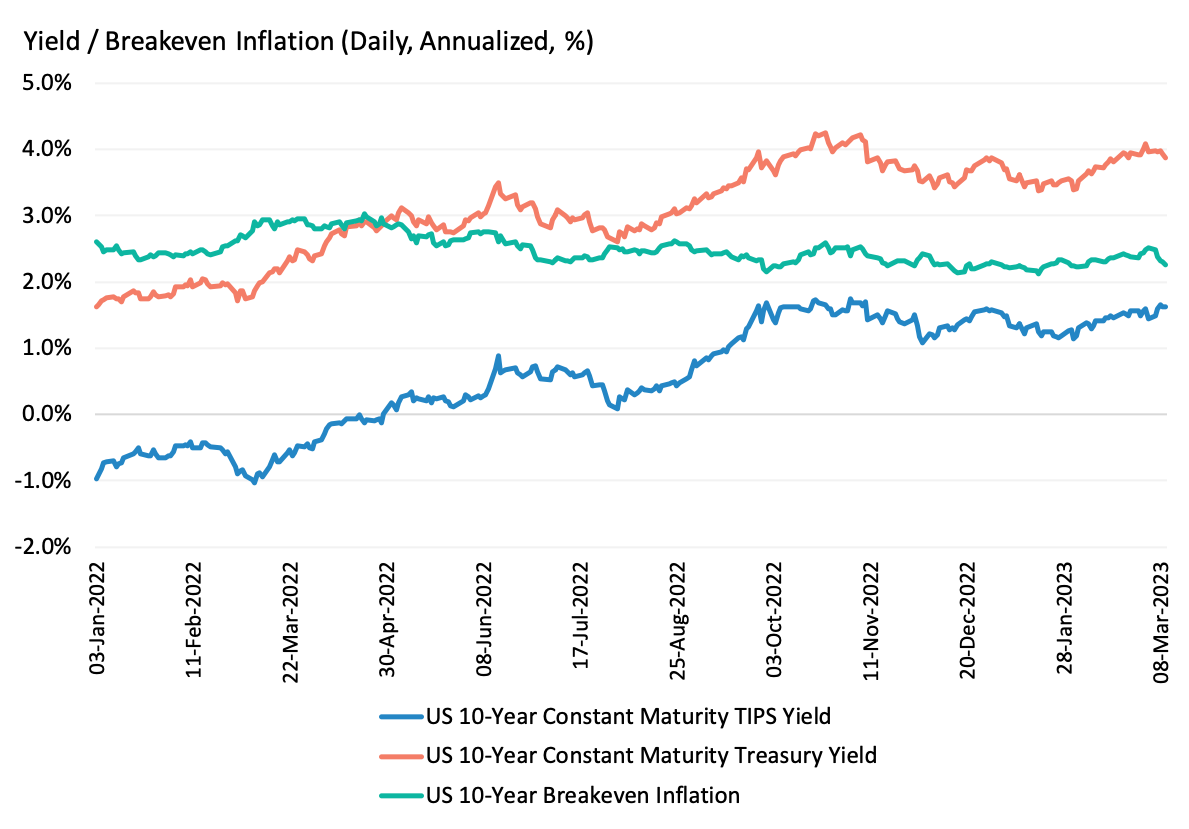
We start by examining the bond market pricing of long-term, demand-driven inflation expectations, the best initial forecast of long-term inflation. Exhibit 1 plots the US 10-Year (nominal) Treasury yield and the US 10-year (real) TIPS yield, and their difference from January 2022 to March 10th, 2023. We interpret the difference - the 10-year breakeven inflation rate - as the market’s expectation for inflation. Interestingly, according to the Exhibit, while the nominal 10-year yield increased markedly (230bps since January 2022), the 10-year real rate rose even more (260 bps). As a result, the 10-year breakeven inflation remained nearly stable over the same period, and even experienced a 30bps decline since the start of 2022, from 2.6% to 2.3 %. Thus, bond markets appear to judge both future fiscal and monetary policies (i.e. the demand-side) to be credible.
A closer examination of government finances provides further backing to this baseline scenario. Indeed, basic government budget considerations link expected inflation levels to the expected levels of net government debt creation (including growth in the monetary base and fiscal surpluses, primarily revenues from taxes). All else equal, higher expected levels of government debt creation over time relative to expectations of future surpluses lead to higher levels of expected inflation today. What matters in this formulation is the expected path of debt creation and whether it can be backed by potential future surpluses (i.e. future real economic growth), not single episodic bursts of new debt.
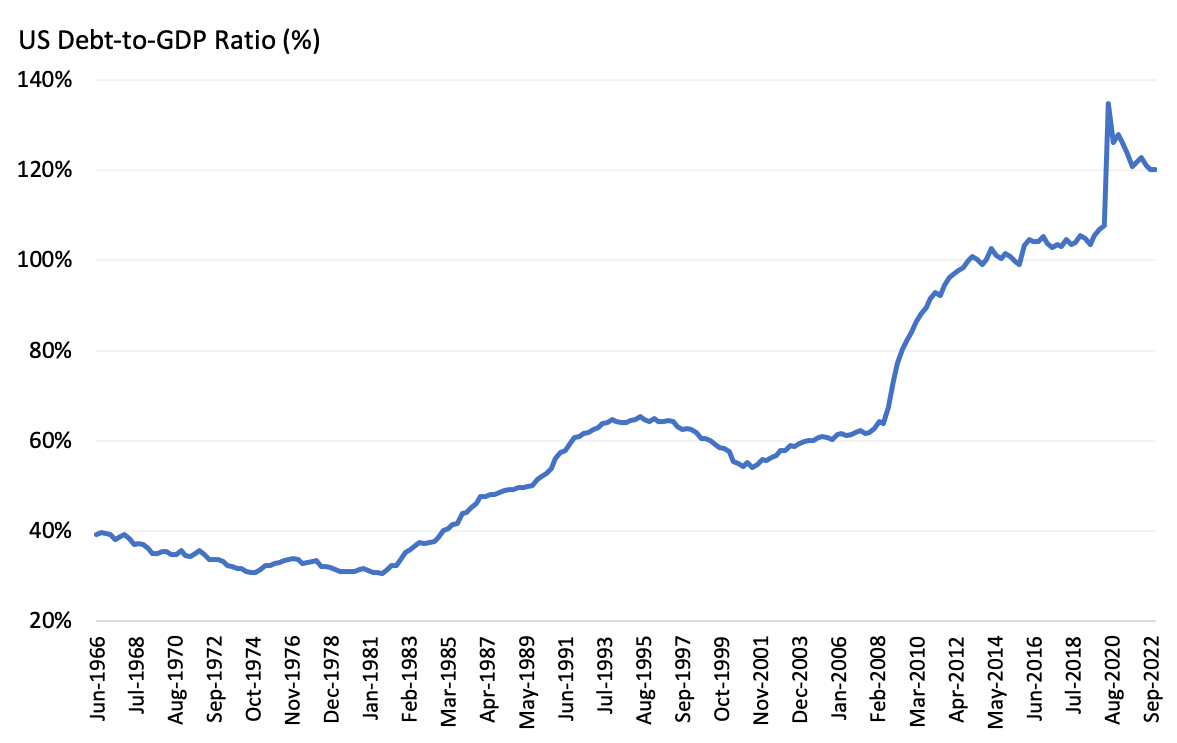
Exhibit 2 shows the evolution of the debt-to-gdp ratio from June 1966 to December 2022. According to the Exhibit, after spiking to about 135% in June 2020 in response to the Covid-19 pandemic, the debt-to-gdp has been declining on trend, to about 120% at the end of 2022. Going forward, we expect this trend to persist, assuming that unbalanced fiscal expansions would be politically unlikely (and that the debt ceiling gets pushed as required), and that long-term growth prospects continue to improve according to our models, albeit at a slow pace. In turn, this declining trend in the debt-to-gdp ratio indicates that long-term (demand-driven) inflation expectations should remain anchored.
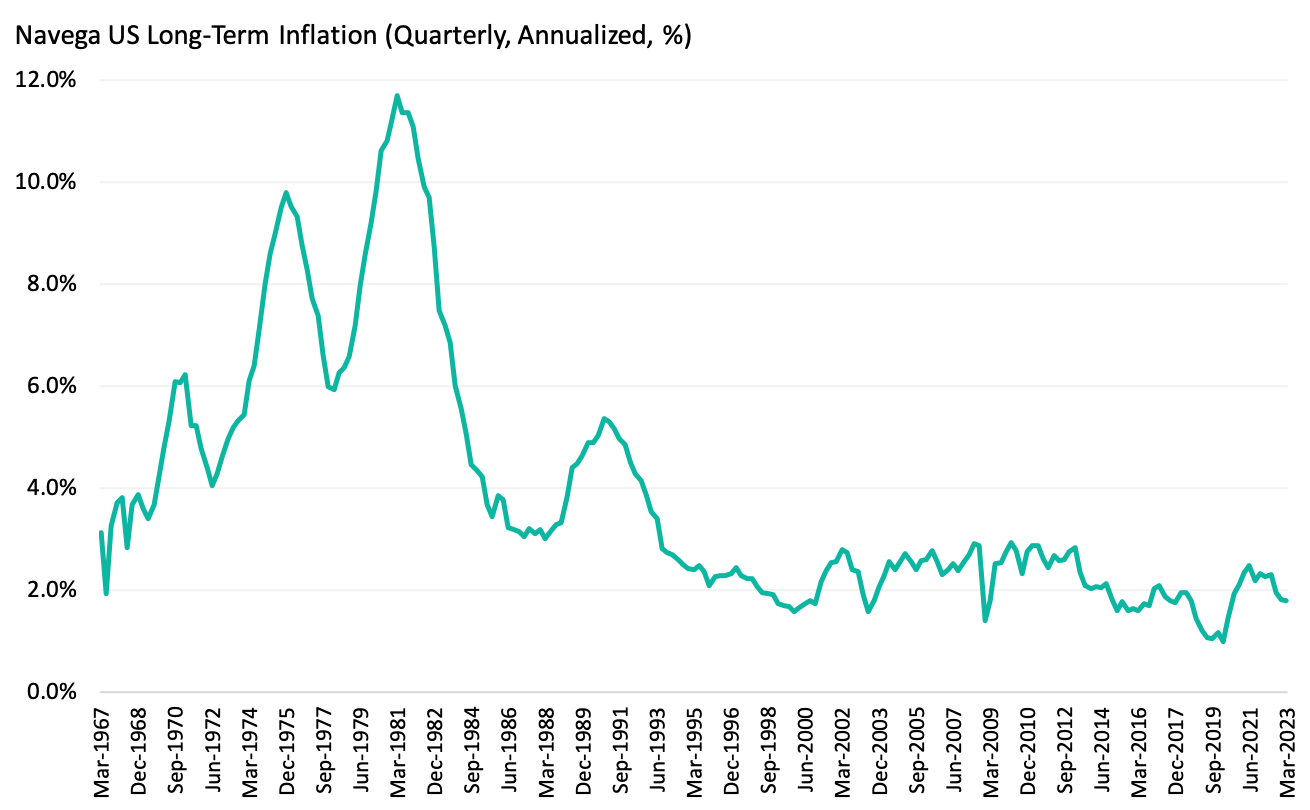
Exhibit 3 confirms this point. The Exhibit shows the evolution of our model's long-term expected inflation from March 1967 to present , combining the long-term inflation expectations implied by both the bond markets and government finances. According to the Exhibit, the expected long-term inflation has remained unchanged since the start of 2022, hovering around 2% - precisely the Fed's target rate. Moreover, according to our calculations, the rate of long-term expected inflation consistent with the assumption that monetary and fiscal policies are not credible would be about 200bps higher at 4%!
That said, this analysis does not necessarily imply that there are no potential upside risks to realised inflation. In other words, the path to the Fed's target rate may well be bumpy. As discussed in our previous paper, long-term inflation expectations implied by bond markets and government finances reflect demand-side driving factors. What can be made out of the remaining 440bps of reported inflation (year-on-year, as of January 2023)? In our view, this excess inflation rate can be attributable to supply-side effects. As is well known, supply-side inflation is driven by the presence of frictions to market pricing. These frictions dissipate when normal market-based mechanisms are allowed to function. Should these frictions become further amplified, however, observed high inflation rates could persist or could rise further.
This document is for informational purposes only. This document is intended exclusively for the person to whom it has been delivered, and may not be reproduced or redistributed to any other person without the prior written consent of Navega Strategies LLC (“Navega”). The information contained herein is based on Nageva’s proprietary research analytics of data obtained from third party statistical services, company reports or communications, publicly available information, or other sources, believed to be reliable. However, Navega has not verified this information, and we make no representations whatsoever as to its accuracy or completeness. Navega does not intend to provide investment advice through this document. This document is in no way an offer to sell or a solicitation of an offer to buy any securities. Investing in securities involves risk of loss, including a loss of principal, that clients should be prepared to bear. Past performance is not indicative of future results, which may vary materially. While this summary highlights important data, it does not purport to capture all dimensions of risk. The methodology used to aggregate and analyze data may be adjusted periodically. The results of previous analyses may differ as a result of those adjustments. Navega has made assumptions that it deems reasonable and used the best information available in producing any calculations herein. Statements that are nonfactual in nature, including opinions, projections and estimates, assume certain economic conditions and industry developments and constitute only current opinions that could be incorrect and are subject to change without notice. All information provided herein is as of the delivery date the document (unless otherwise specified) and is subject to modification, change or supplement in the sole discretion of Navega without notice to you. This information is neither complete nor exact and is provided solely as reference material with respect to the services offered by Navega. Information throughout this document, whether stock quotes, charts, articles, or any other statement or statements regarding market or other financial information, is obtained from sources which we and our suppliers believe reliable, but we do not warrant or guarantee the timeliness or accuracy of this information. The information presented here has not been personalized, and is not based on the financial circumstances of the recipient. This information may not be applicable to your particular financial needs, and should not, by itself, be used to make determinations regarding the purchase or sale of securities, or other investment decisions.
The model performance information presented is based on the application of Navega’s factor analysis, backtested against actual historical data. “Backtesting” is a process of objectively simulating historical performance information by applying a set of rules backward in time. The results of the application of Navega’s model do not reflect actual performance or actual historical data. Such models are prepared with the full benefit of hindsight, and it is not likely that similar results could be achieved in the future.
The model portfolios were constructed by Navega with the benefit of hindsight to illustrate certain performance metrics. The performance shown was not actually achieved by any investor. The investments in these hypothetical portfolios were selected with the full benefit of hindsight, after performance over the period shown was known. It is not likely that similar results could not be achieved in the future. The hypothetical portfolios presented here are purely illustrative, and representative only of a small sample of possible scenarios.
The projections shown do not represent actual performance, and are based on assumptions which may not occur. It is possible that the markets will perform better or worse than shown in the projections, the actual results of an investor who invests in the manner these projections suggest will be better or worse than the projections, and an investor may lose money by relying on these projections.