Pundits' skepticisms about monetary authorities' ability to harness inflation without growth recession continue to defy empirical observations and modern (common sense) economic thinking. According to our models, major economies' macro fundamentals and market pricing are consistent with more certainty about well-anchored long-term inflation expectations. To reiterate our view, this (pundits') cognitive dissonance relative to fundamentals and market pricing is driven by an obsession on the short-term effects of past monetary policies and old (pre-70s) economics theory. Instead, according to actual experience and modern economic thinking, it is the long-term expectation of real economic growth and the credibility of future policy path anchoring long-term inflation expectations that matters. Our previous note addressed the growth expectations question: there is more certainty about a slow, but improving long-term real global economic growth. This note focuses on the policy credibility and inflation expectations issue.
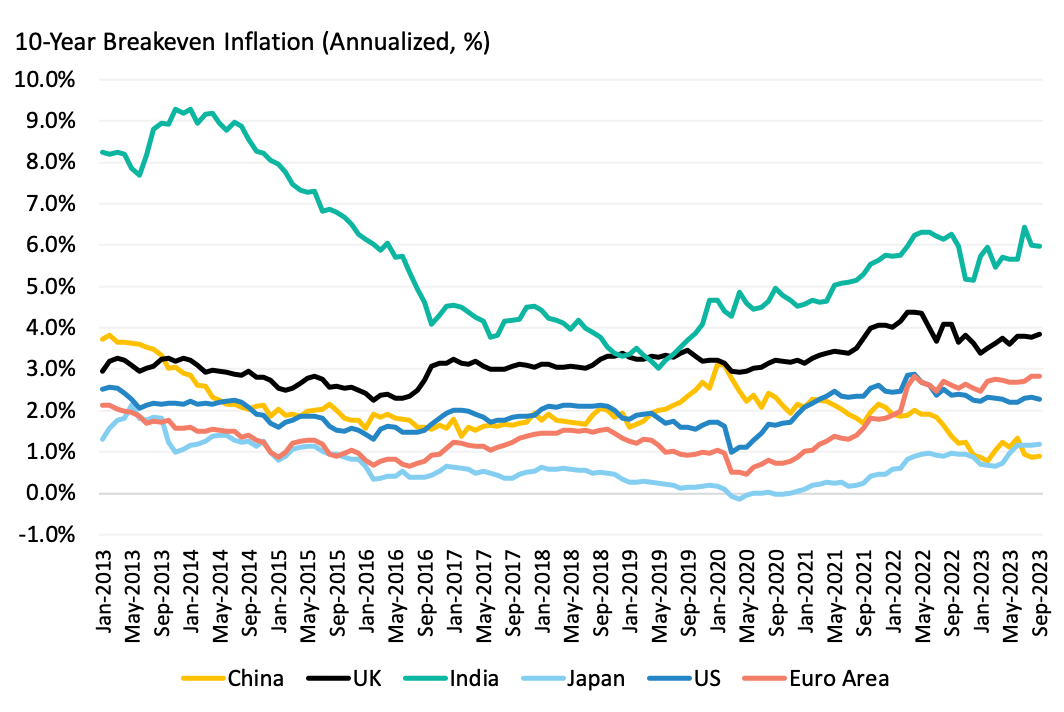
Our starting point to gauge inflation expectations is bond market pricing. Exhibit 1 portrays the evolution, from January 2013 to October 2023, of 10-Year breakeven inflation rates for major economies. According to the Exhibit, inflation expectations implied by bond markets have remained stable overall and well below realised inflation rates over the past year. With the exception of China and Japan, though, they are still higher than central bank target rate . Despite this positive spread, our view is that bond markets continue to perceive future monetary and fiscal policies to be credible. A number of empirical observations lend support to this view:
From a purely statistical standpoint, this spread is not significant when compared to the historical standard deviation of inflation rates .
Spreads would have to be significantly higher to signal lack of credibility .
Breakeven inflation would also have to be at least as high as realised inflation rates.
Finally realised inflation rates would have to continue to increase persistently. As a matter of fact, over the past year, realised inflation rates have continued to fall.
The question, then, is why would the bond market judge monetary and fiscal policies to be credible? The principal reason is that monetary authorities of these major economies are all committed to bring inflation back to their target rates. This commitment has been reflected in the significant increases in central banks' refinancing rates . Monetary authorities also strongly signalled their intention to continue to do so, following their monitoring of inflation data, and the evolution of the macro and markets environment.
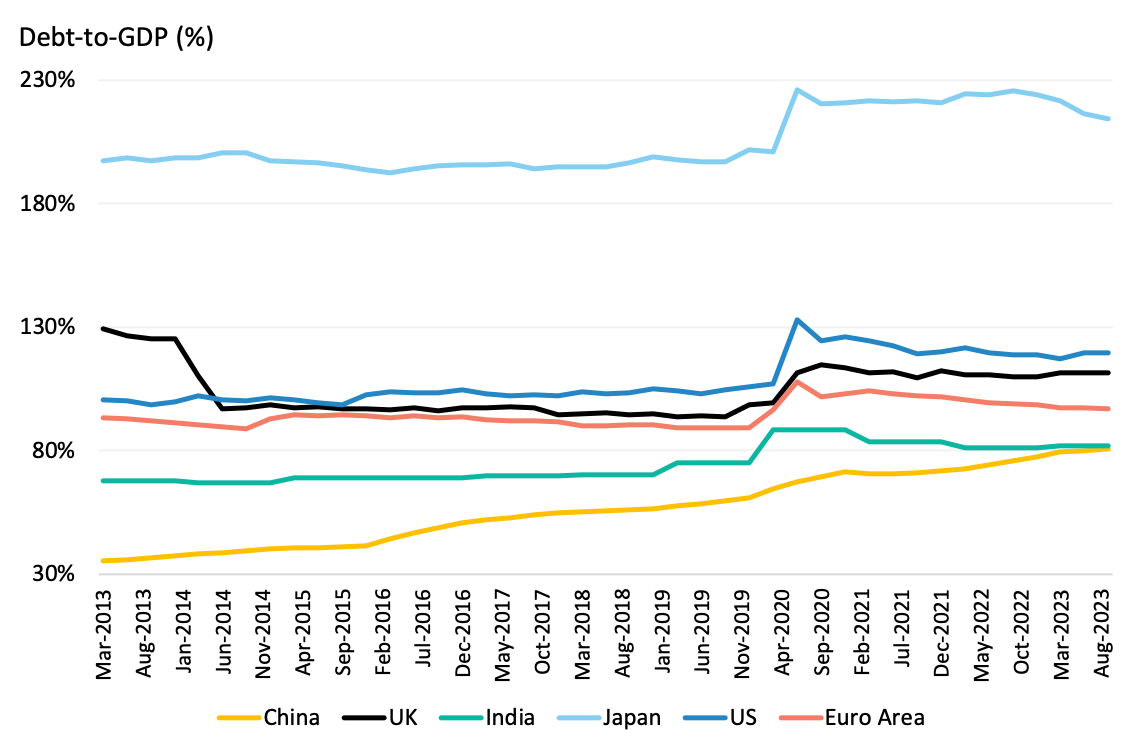
Moreover, these statements seem well backed by government budget constraint considerations. Exhibit 2 depicts the evolution of the debt-to-gdp ratio since 2013, for the same major economies. As shown in the Exhibit, with the exception of China (which does not seem to suffer from high inflation at this stage), debt-to-gdp ratios have declined from their pandemic induced peak level and have remained stable in the past year . Further expansion of (unbacked) deficit financing strikes us as politically unlikely. These government finances considerations link expected inflation levels to the expected levels of net government debt creation (including growth in the monetary base and fiscal surpluses, primarily revenues from taxes). All else equal, higher expected levels of government debt creation over time relative to expectations of future surpluses lead to higher levels of expected inflation today. What matters is the expected path of debt creation and whether it can be backed by potential future surpluses (i.e. future real economic growth), not single episodic bursts of new debt. In turn this question is closely tied to the path for real growth and real growth uncertainty.
In this context, greater certainty about slow but improving long-term growth prospects, as shown in our previous note, lends support to monetary and fiscal credibility. Said differently, these growth trends also imply greater certainty (i.e. receding uncertainty) about benign and declining inflation expectations evolving closer to central banks' target rate.
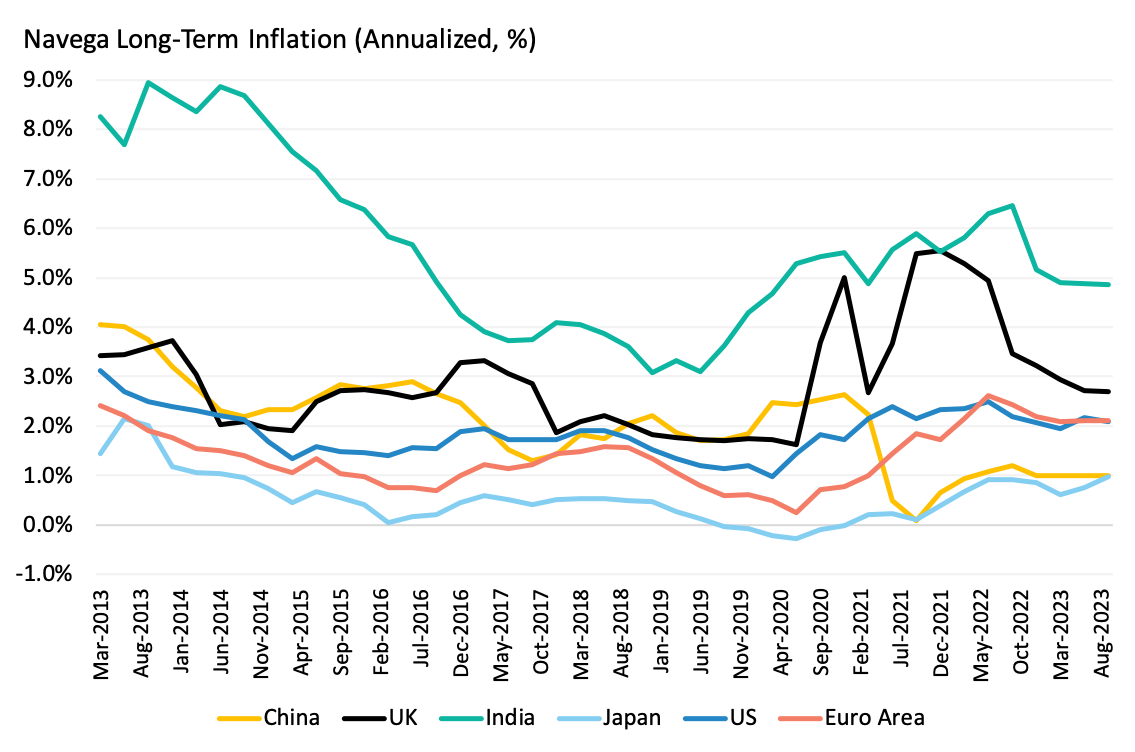
Exhibit 3 portrays the evolution of long-term inflation expectations implied by our models, for the same major economies. In the case of the US and the Euro area, our model inflation expectations have continued to decline in the past year to about 2.1%, a level barely above the central bank target rate of 2%. In the case of the UK, inflation expectations have also continued to decline, by a large margin, from their post-pandemic high of 5.6% to 2.7%. In India, long-term inflation expectations have also declined to about 4.9%, well within the target range of the Reserve Bank of India of 2% to 6% .
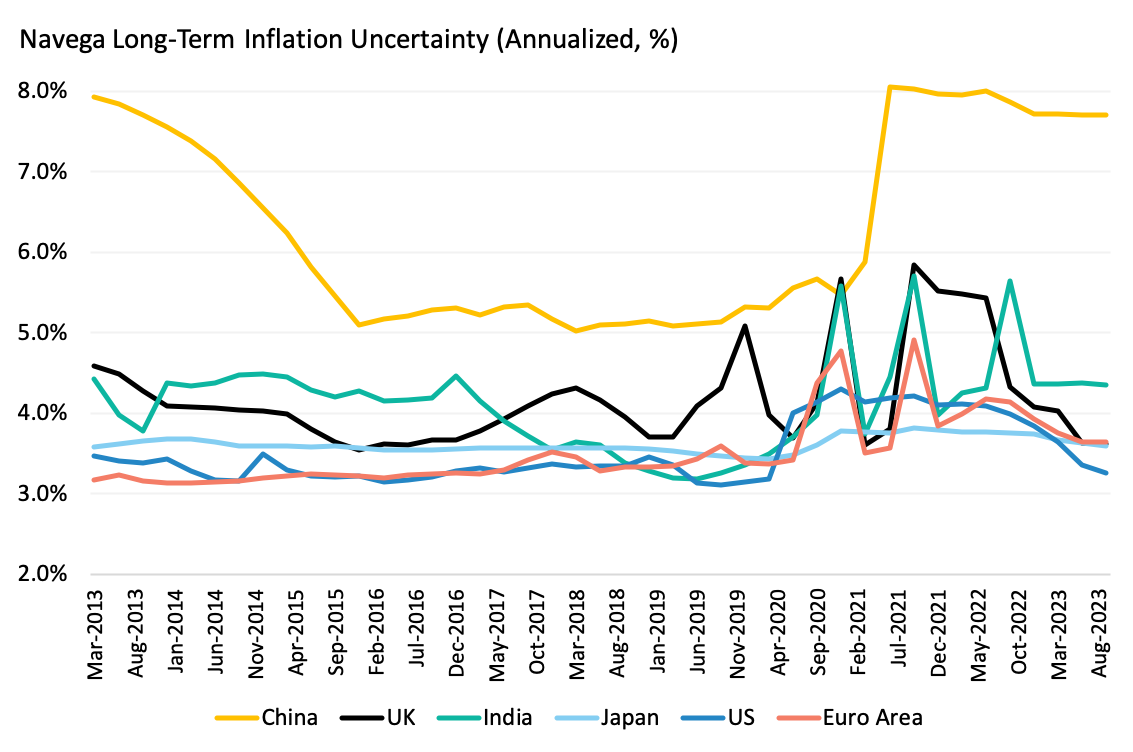
As shown in Exhibit 4, long-term inflation uncertainty implied by our models has been receding about these rather benign long-term inflation expectations, for all major economies except China. Inflation uncertainty (with the exception of China) is now back to pre-pandemic levels. These trends have been primarily driven by the decline in long-term growth uncertainty. In the case of China, growth uncertainty is still persistently high, as shown in our previous note. In turn, inflation uncertainty also remains high, according to our models.
That said, markets' (and our models') perception of policy credibility does not necessarily imply a smooth transition of realized inflation rates toward central bank target rates. Indeed, this path remains subject to the normalisation of energy prices, supply frictions, geopolitical tensions and fluctuations in the global macro and markets environment. However, the takeaway for investors is that there are opportunities in the resolution of these frictions. For example, real economic growth and growth uncertainty trends across countries have become fragmented since the pandemic. According to our models, these spreads in real growth trends, should they persist, imply further differentiation in expected inflation rates and expected asset returns across countries. We will continue to explore these trends and their investment implications in our next note.
This document is for informational purposes only. This document is intended exclusively for the person to whom it has been delivered, and may not be reproduced or redistributed to any other person without the prior written consent of Navega Strategies LLC (“Navega”). The information contained herein is based on Nageva’s proprietary research analytics of data obtained from third party statistical services, company reports or communications, publicly available information, or other sources, believed to be reliable. However, Navega has not verified this information, and we make no representations whatsoever as to its accuracy or completeness. Navega does not intend to provide investment advice through this document. This document is in no way an offer to sell or a solicitation of an offer to buy any securities. Investing in securities involves risk of loss, including a loss of principal, that clients should be prepared to bear. Past performance is not indicative of future results, which may vary materially. While this summary highlights important data, it does not purport to capture all dimensions of risk. The methodology used to aggregate and analyze data may be adjusted periodically. The results of previous analyses may differ as a result of those adjustments. Navega has made assumptions that it deems reasonable and used the best information available in producing any calculations herein. Statements that are nonfactual in nature, including opinions, projections and estimates, assume certain economic conditions and industry developments and constitute only current opinions that could be incorrect and are subject to change without notice. All information provided herein is as of the delivery date the document (unless otherwise specified) and is subject to modification, change or supplement in the sole discretion of Navega without notice to you. This information is neither complete nor exact and is provided solely as reference material with respect to the services offered by Navega. Information throughout this document, whether stock quotes, charts, articles, or any other statement or statements regarding market or other financial information, is obtained from sources which we and our suppliers believe reliable, but we do not warrant or guarantee the timeliness or accuracy of this information. The information presented here has not been personalized, and is not based on the financial circumstances of the recipient. This information may not be applicable to your particular financial needs, and should not, by itself, be used to make determinations regarding the purchase or sale of securities, or other investment decisions.
The model performance information presented is based on the application of Navega’s factor analysis, backtested against actual historical data. “Backtesting” is a process of objectively simulating historical performance information by applying a set of rules backward in time. The results of the application of Navega’s model do not reflect actual performance or actual historical data. Such models are prepared with the full benefit of hindsight, and it is not likely that similar results could be achieved in the future.
The model portfolios were constructed by Navega with the benefit of hindsight to illustrate certain performance metrics. The performance shown was not actually achieved by any investor. The investments in these hypothetical portfolios were selected with the full benefit of hindsight, after performance over the period shown was known. It is not likely that similar results could not be achieved in the future. The hypothetical portfolios presented here are purely illustrative, and representative only of a small sample of possible scenarios.
The projections shown do not represent actual performance, and are based on assumptions which may not occur. It is possible that the markets will perform better or worse than shown in the projections, the actual results of an investor who invests in the manner these projections suggest will be better or worse than the projections, and an investor may lose money by relying on these projections.