An important (maybe even key) feature of a market correction is that it gives investors an opportunity to revisit the logic behind both their investment strategy and individual investments. In this respect, this year’s market selloff should be no different than any other. As has happened after every other selloff, today’s trendy investments will be re-examined. Equally importantly, investors will re-learn two fundamental principles:
Virtually all investments depend on market returns
Diversification and risk levels are still important
This note examines these points in the context of two widely followed (and trendy) investments: cryptocurrency (more specifically Bitcoin) and Tesla. Our analysis will build on the analysis of an earlier note. The discussion here suggests that the extraordinary gains associated with both of these are in part attributable to significant market exposure, and partly due to the usual hype that surrounds specific investments in asset pricing near-bubbles.
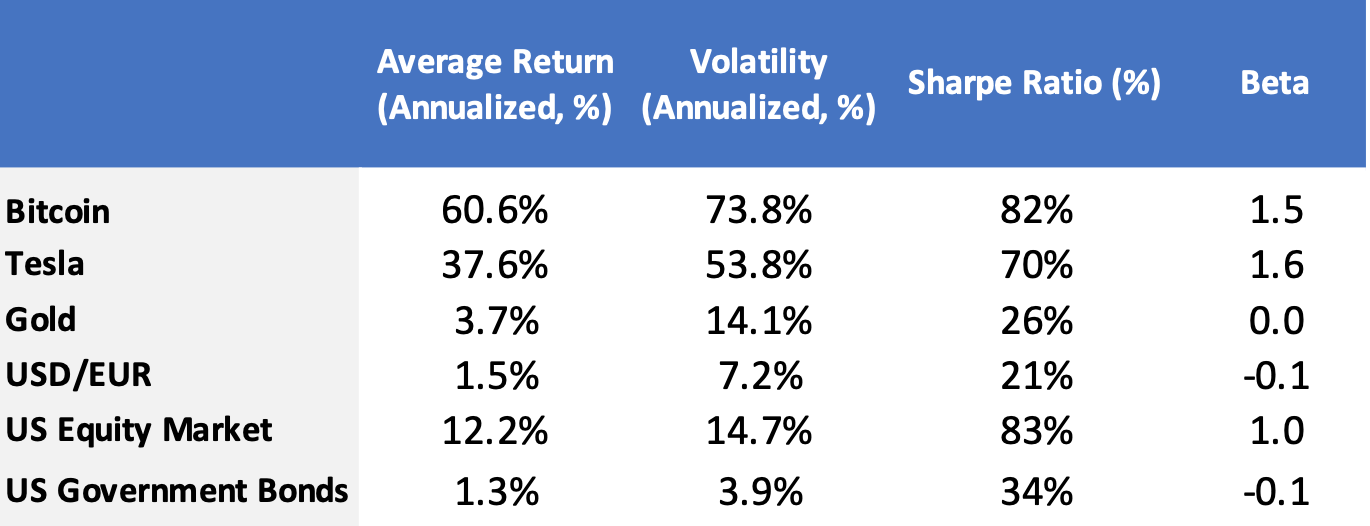
Our previous note showed the average return, volatility (standard deviation of returns), and betas relative to the market for Tesla, Bitcoin, USD/EUR, and US government bonds. We reproduce these figures in Exhibit 1. The key takeaways from the exhibit are:
Bitcoin and Tesla returns depend heavily on market returns (as measured by the betas)
Government bonds and the USD/EUR exchange rate are significantly less risky than all other investments in this table
Bitcoin volatility is significantly higher than USD/EUR volatility
The average annual return figures in Exhibit 1 are historical average returns over a common time period. Let’s look, though, at a different problem: how much of year-to-date performance can be accounted for by the market?
This point is addressed in Exhibit 2. The exhibit shows the year-to-date performance on each of the assets from Exhibit 1; the y-t-d performance relative to a riskless asset; the y-t-d excess return as predicted by the betas from Exhibit 1, and the difference between the actual and predicted performance.
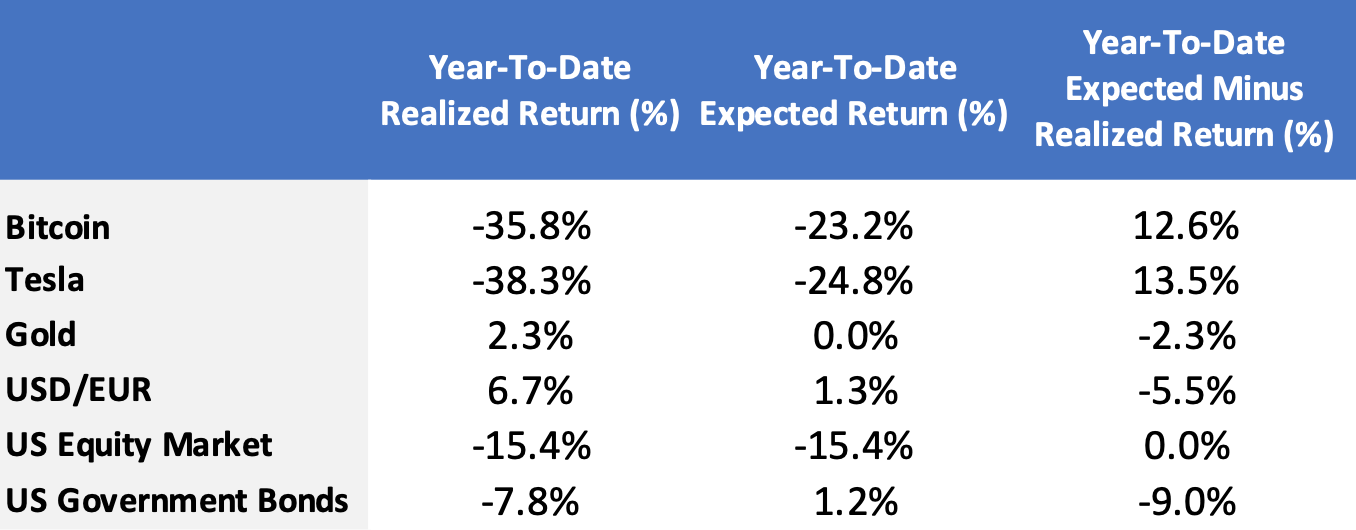
What can we infer from the figures in Exhibit 2? First, Bitcoin and Tesla’s year-to-date returns depended heavily on the market (as indicate by the high betas). Second, both Bitcoin and Tesla underperformed even the market-adjusted performance. Third, bitcoin underperformed (by a significant amount) the government bond market and the USD/EUR exchange rate. The moral of the story continues to be that investors should still ponder how every investment (actual and potential) will perform during market rallies and selloffs.
At this point in the history of applied portfolio theory, it is a mystery to us why some investors do not incorporate risk considerations in their portfolio design. This year’s market selloff and the knock-on effects illustrated in the previous section should hopefully help investors re-learn the (obvious) lessons that: (a) higher risk portfolios have a higher potential downside and (b) diversification can still pay.
We’ll examine these points in the context of the simple portfolios from our earlier note. These portfolios are shown in Exhibit 3. The portfolios in the exhibit were chosen to illustrate how risk budgets can be used in portfolio construction. The main point of the exhibits are: (a) risk allocations and capital allocations are not the same things, and (b) risk reduction only occurs when lower-risk assets are included in the portfolio.
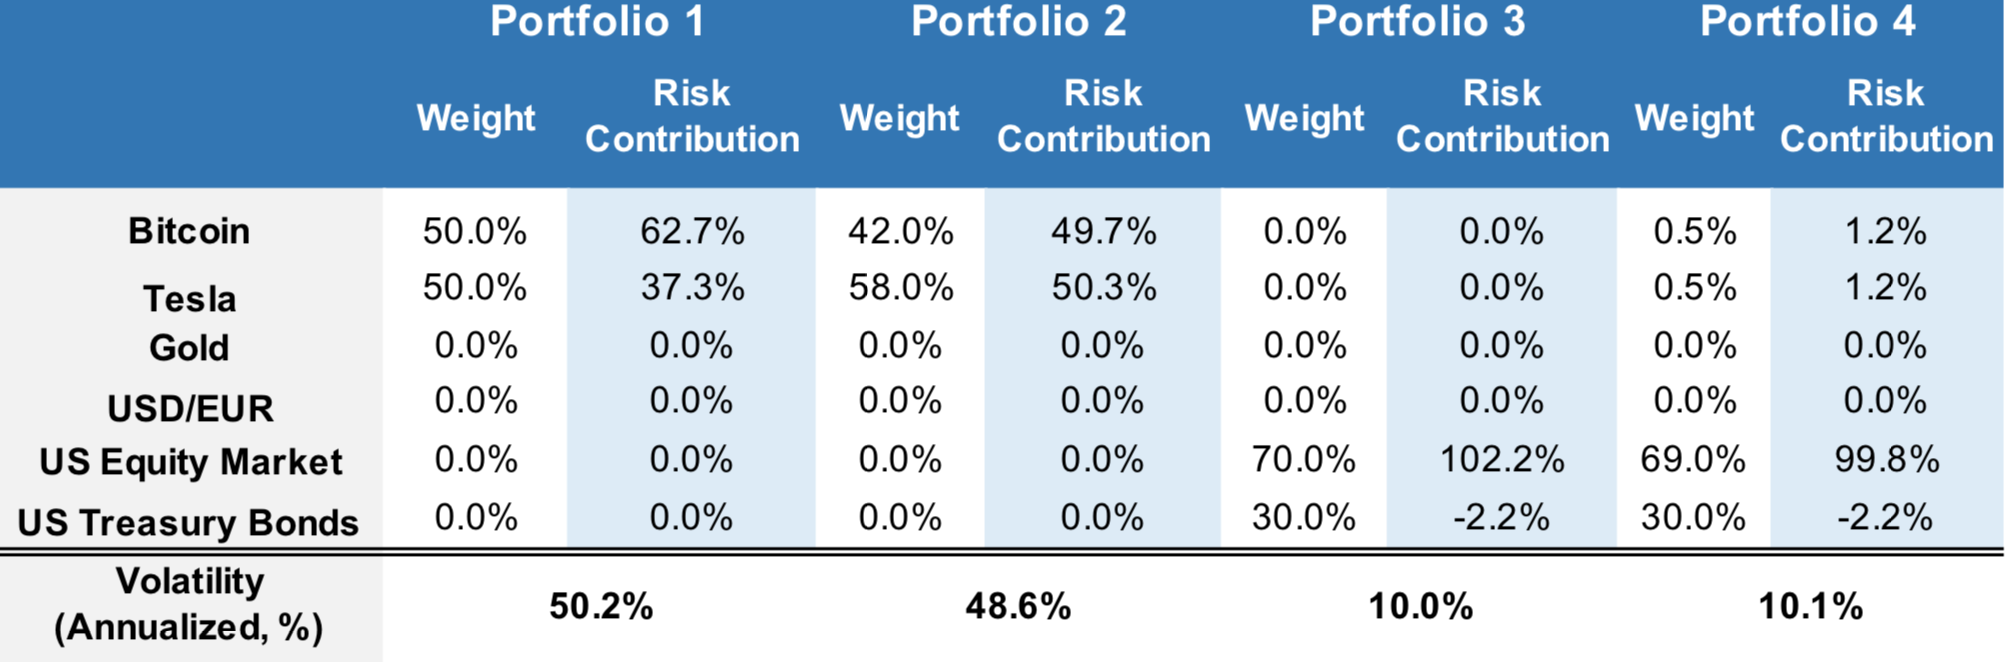
In the exhibit, the first portfolio has a 50/50 capital allocation between Tesla and Bitcoin; the second portfolio reallocates capital between these two assets to produce an equal contribution to portfolio risk; the third portfolio allocates capital to the US Equities and US government bonds, while the last portfolio reallocates capital so that all risk contributions are positive.
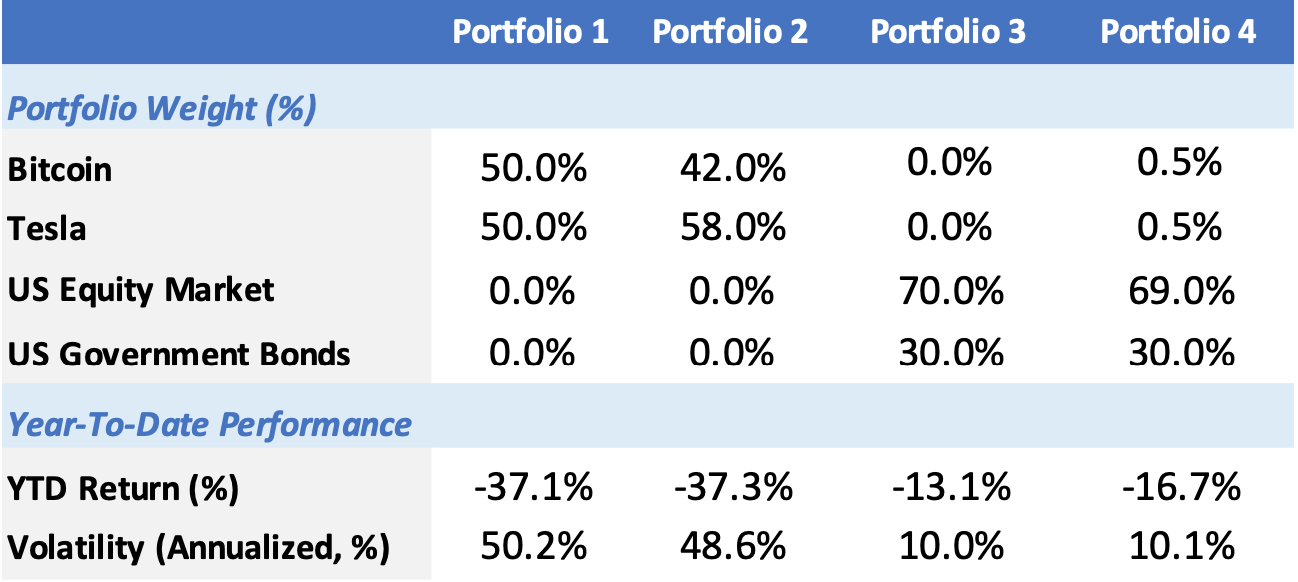
Exhibit 4 shows the year-to-date performance of each of these portfolios. Unsurprisingly the better-diversified (but still concentrated) portfolio underperformed less than the most concentrated portfolio. Finally, the lower risk portfolios did better than the concentrated portfolio.
It continues to baffle us why investors have to relearn the same lessons about the relevance of the market for all assets, diversification, and that high non-market risk does not always pay off. With any luck, this market downturn will help these lessons sink in for a few more investors.
Every downturn also prompts questions that are unique to specific asset classes and that particular downturn. For our examples here, the questions that occur to us are the following: (1) what are the economic use cases for cryptocurrency, given that it demonstrably does not act as a currency? (2) Conditioned on an answer to (1), what role should cryptocurrency play in specific portfolios? (3) Can Tesla’s valuations be justified relative to other car manufacturers, both short and long-term? We are sure that the next downturn (and there will be another at some point in the future) will prompt its own set of questions.
This document is for informational purposes only. This document is intended exclusively for the person to whom it has been delivered, and may not be reproduced or redistributed to any other person without the prior written consent of Navega Strategies LLC (“Navega”). The information contained herein is based on Nageva’s proprietary research analytics of data obtained from third party statistical services, company reports or communications, publicly available information, or other sources, believed to be reliable. However, Navega has not verified this information, and we make no representations whatsoever as to its accuracy or completeness. Navega does not intend to provide investment advice through this document. This document is in no way an offer to sell or a solicitation of an offer to buy any securities. Investing in securities involves risk of loss, including a loss of principal, that clients should be prepared to bear. Past performance is not indicative of future results, which may vary materially. While this summary highlights important data, it does not purport to capture all dimensions of risk. The methodology used to aggregate and analyze data may be adjusted periodically. The results of previous analyses may differ as a result of those adjustments. Navega has made assumptions that it deems reasonable and used the best information available in producing any calculations herein. Statements that are nonfactual in nature, including opinions, projections and estimates, assume certain economic conditions and industry developments and constitute only current opinions that could be incorrect and are subject to change without notice. All information provided herein is as of the delivery date the document (unless otherwise specified) and is subject to modification, change or supplement in the sole discretion of Navega without notice to you. This information is neither complete nor exact and is provided solely as reference material with respect to the services offered by Navega. Information throughout this document, whether stock quotes, charts, articles, or any other statement or statements regarding market or other financial information, is obtained from sources which we and our suppliers believe reliable, but we do not warrant or guarantee the timeliness or accuracy of this information. The information presented here has not been personalized, and is not based on the financial circumstances of the recipient. This information may not be applicable to your particular financial needs, and should not, by itself, be used to make determinations regarding the purchase or sale of securities, or other investment decisions.
The model performance information presented is based on the application of Navega’s factor analysis, backtested against actual historical data. “Backtesting” is a process of objectively simulating historical performance information by applying a set of rules backward in time. The results of the application of Navega’s model do not reflect actual performance or actual historical data. Such models are prepared with the full benefit of hindsight, and it is not likely that similar results could be achieved in the future.
The model portfolios were constructed by Navega with the benefit of hindsight to illustrate certain performance metrics. The performance shown was not actually achieved by any investor. The investments in these hypothetical portfolios were selected with the full benefit of hindsight, after performance over the period shown was known. It is not likely that similar results could not be achieved in the future. The hypothetical portfolios presented here are purely illustrative, and representative only of a small sample of possible scenarios.
The projections shown do not represent actual performance, and are based on assumptions which may not occur. It is possible that the markets will perform better or worse than shown in the projections, the actual results of an investor who invests in the manner these projections suggest will be better or worse than the projections, and an investor may lose money by relying on these projections.