Since the introduction of Bitcoin in 2009 crypto currency has occupied the imaginations of many investors, in large part due to its relatively high returns: since 2014, Bitcoin has had an average annual return of approximately 61%, while Ethereum has had an average annual return of 55% since 2017. Moreover, as of 31/01/2022 the total capital globally held in crypto currency adds up to approximately $1.7 trillion.
Despite the understandable investor interest in crypto currency, a number of open issues remain. These issues are both practical and theoretical. From the practical perspective, investors’ main question is to determine how much capital to allocate to crypto currency versus other investments? The often-debated but principle theoretical question is what is the fundamental economic underpinning of crypto returns?
This note develops a structured framework that addresses the allocation to crypto currency relative to other investment choices. We start with the practical issue for two reasons: first, our framework builds on models that should be familiar to most investors; second, this framework provides a foundation for considering the theoretical issues. Subsequent notes will focus more specifically on these fundamental points.
By now, most investors are familiar with finding capital allocations to multiple asset classes by using risk and expected return assumptions. Those assumptions include each asset class’s volatility of return, its correlation with the return to all of the other asset classes and its expected return. In our minds, a reasonable starting point for the analysis is to calculate the historical volatility of crypto currencies with standard asset classes and existing fiat currencies.
As an illustrative example, Exhibit 1 shows the historical volatility of monthly returns for Bitcoin ; US equities (as measured by the Vanguard Total Stock Market Index ETF); US Treasury bonds (as measured by the iShares US Treasury Bond ETF); Tesla; Gold, and the USD/EUR exchange rate. Tesla was chosen because it is another asset that has generated high returns and significant public attention, while Gold and the USD/EUR exchange rate were chosen as illustrative of perceived alternative substitutes to bonds. The exhibit shows the average return over the sample period for each asset or currency, as well as the beta against the equity market and the Sharpe ratio. All returns are excess returns (over the 3-month treasury bill). The statistics are measured with monthly returns over the period Oct 1, 2014 through December 31, 2021.
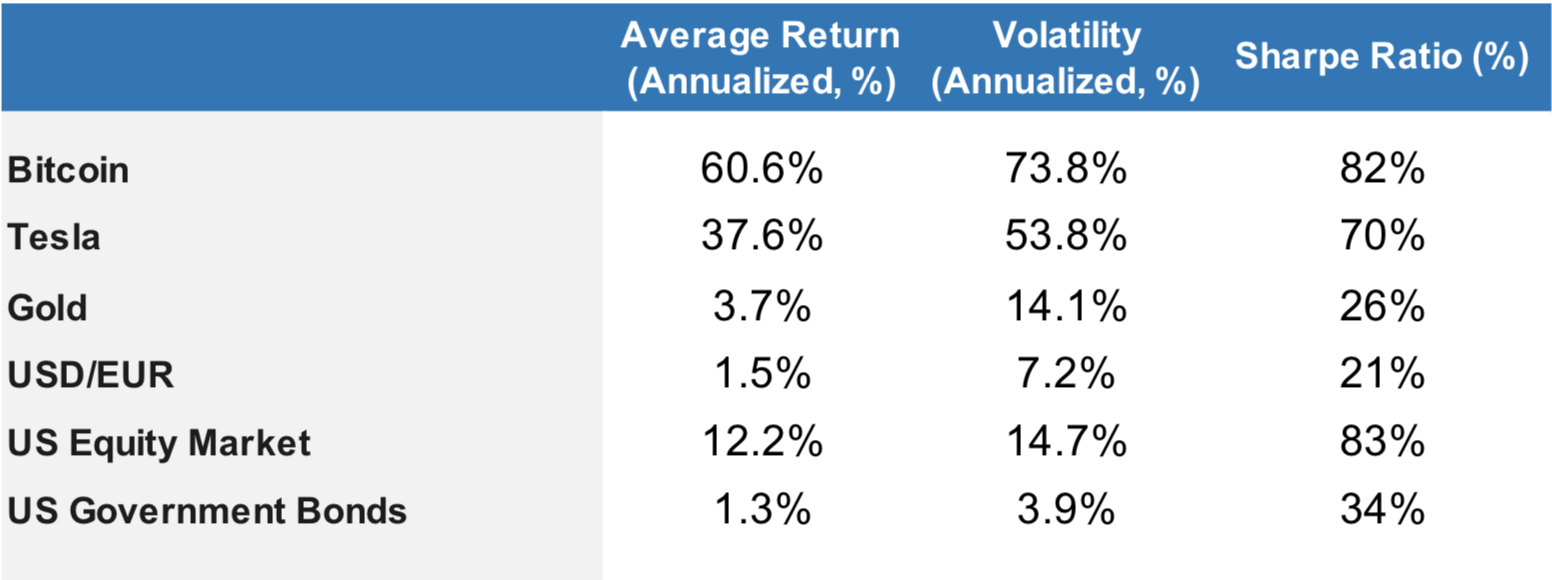
Three points are clear from the exhibit, and likely to be known by all investors considering crypto currency:
First, cryptocurrency returns have been more volatile than any of the other assets and USD/EUR.
Second, the average cryptocurrency return has exceeded (vastly) the average return on all of the assets and USD/EUR.
Third, this higher realized return seems to aligned with the higher risk: crytpo currency has about the same realized risk-adjusted return, as measured by the Sharpe Ratio , as Tesla and the broad equity market.
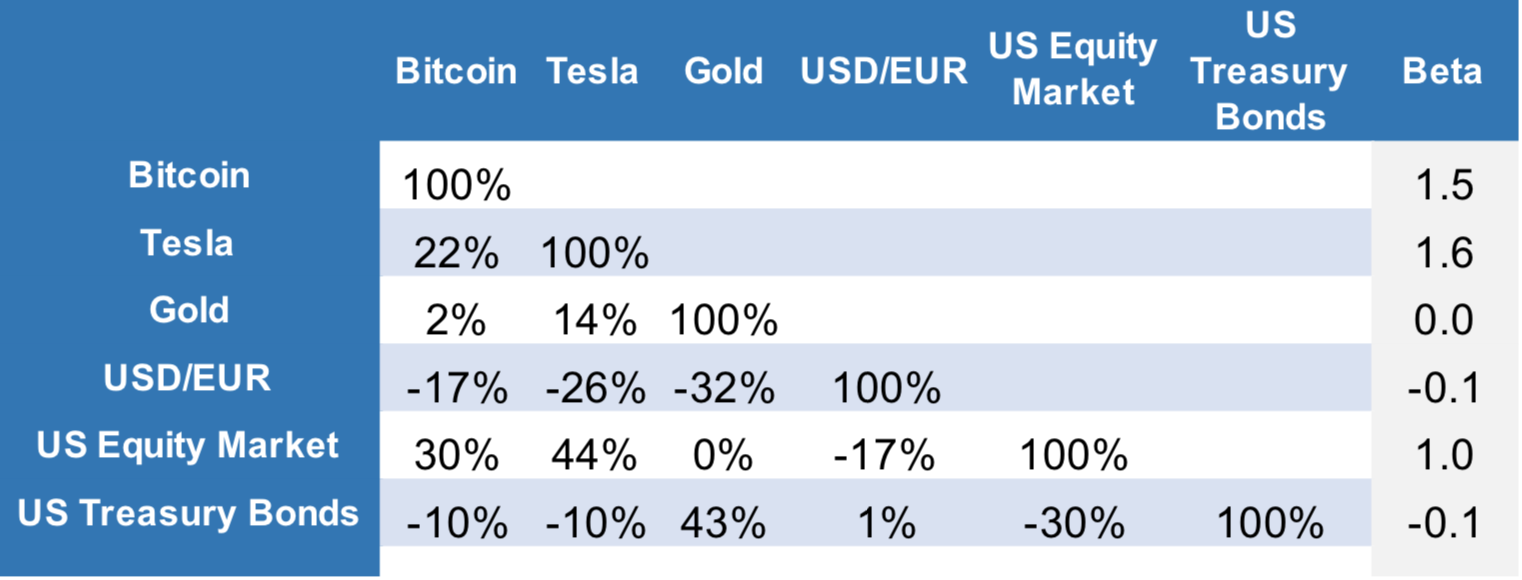
Each asset's beta to the equity market and the historical correlation between asset returns, shown in Exhibit 2, provide more information about the relationship between returns. Several observations are in order:
Bitcoin and Tesla returns were positively correlated with equity market returns. Hence, Bitcoin and Tesla holders should expect to have positive returns when the market has positive returns, all else equal.
Bitcoin and Tesla betas were significantly larger than 1.0, indicating that all else equal, their returns will outperform the market during rallies and underperform during selloffs, all else equal.
Gold, bonds and the USD/EUR exchange rate are all risk-reducing assets, as they have correlations to equities that are close to zero or negative. In addition, bonds and the USD/EUR rate are significantly less volatile than the other asset classes.
The negative correlation between Bitcoin and bonds and USD/EUR suggests that Bitcoin is not (yet) trading as a currency substitute. Close currency substitutes should have correlations closer to 1.0, significantly lower volatility, and significantly lower or negative correlation with the equity market.
We propose to address the issue of capital allocations to crypto currency through an analysis of alternative risk budgets , rather than finding allocations through the use of standard mean-variance optimization .
By contrast, focusing on risk budgets means that investors can make use of more easily estimable quantities such as volatility and correlation (for example, the data in Exhibits 1 and 2). Moreover, they can use these data to answer three questions:
1. How much risk is embedded in the current portfolio?
2. How much risk is allocated to each investment?
3. What happens to risk levels and risk allocation if capital is reallocated?
For example, Exhibit 3 shows the allocations, risk levels and risk attributions for four different portfolios. In the first portfolio, capital is split 50/50 between Bitcoin and Tesla. In the second portfolio, capital is reallocated from Bitcoin to Tesla so that the contributions to portfolio risk are split equally between each investment. The third portfolio is a standard allocation to equities and bonds, with 70% held in equities. In the final portfolio, 1% of capital is reallocated away from the equity market and into the risk balanced Bitcoin/Tesla portfolio.
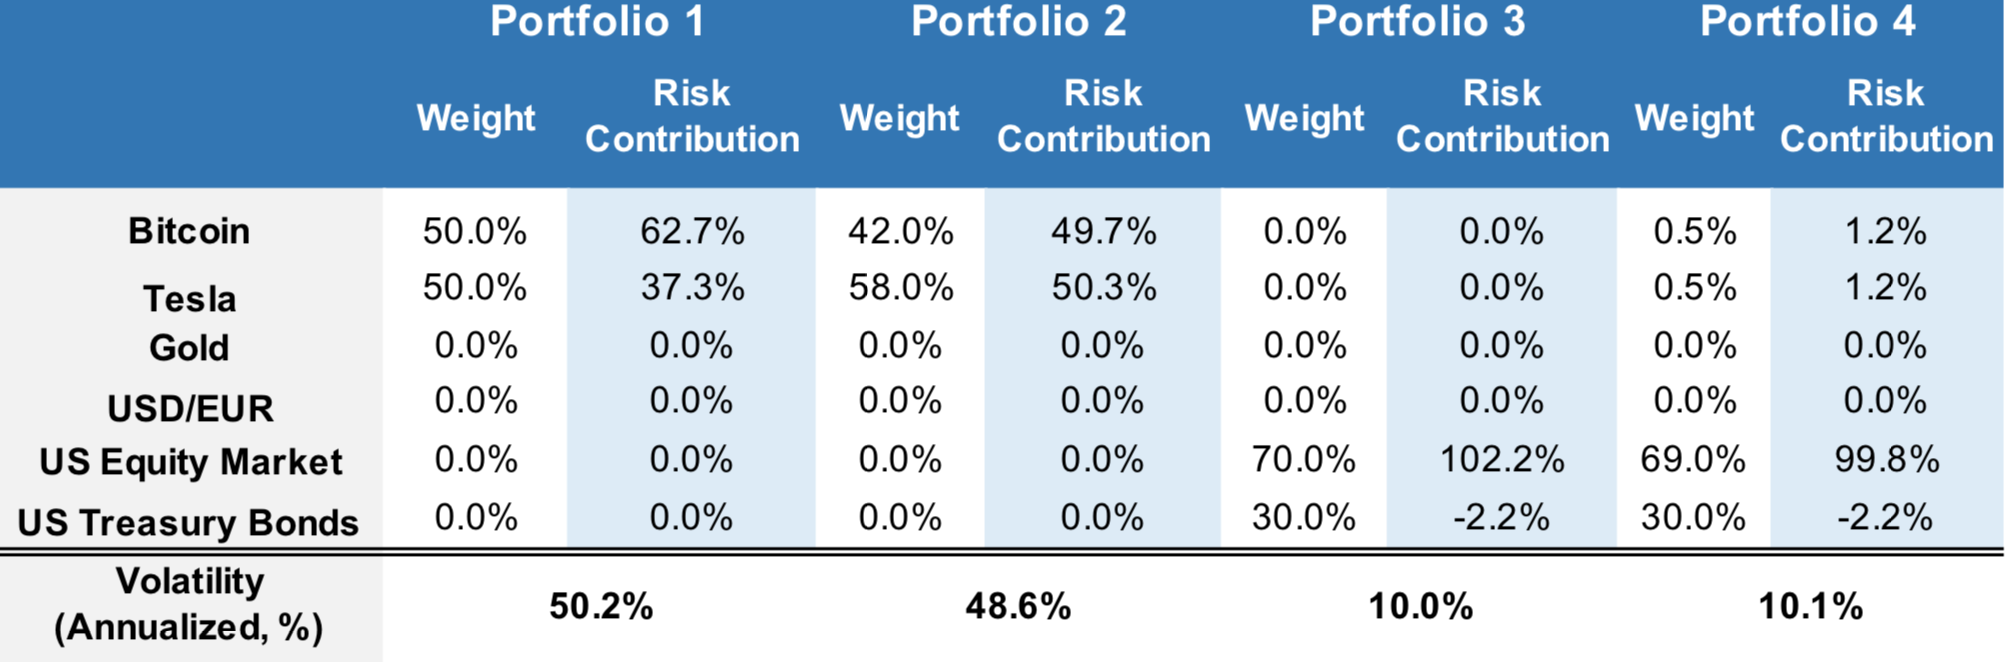
None of the results in Exhibit 3 should be seen as especially surprising. Shifting allocations away from Bitcoin into Tesla reduces overall portfolio volatility from around 50% to just over 48%, with a more diversified portfolio. The risk reduction is due primarily to the lower volatility of Tesla relative to Bitcoin and the low correlation between the two return series. Similarly, it shouldn’t be surprising that a standard 70/30 portfolio has a much lower overall volatility than the Bitcoin/Tesla portfolio. Finally, it shouldn’t be surprising that even a small allocation to the Bitcoin/Tesla portfolio increases overall portfolio risk.
To be clear, this example doesn’t propose to answer the question of which portfolio is best. Each investor needs to make that determination on the basis of their own risk tolerance and their own views about relative investment returns. Rather, the example is meant to illustrate a practical approach that investors can take to differentiate between alternative portfolios.
The purpose of this note is to illustrate an approach to the challenge of determining allocations to crypto currency. Our intention was not to advocate for crypto currency (nor Tesla). Ultimately, what drives allocations to crypto currency are investor-specific views on relative returns and risk.
We propose to address the underlying economics of crypto currency risk and return in our next note. More specifically, that note will consider the open fundamental questions, and how alternative resolutions to those questions could affect forward looking risk and return views for crypto currency.
This document is for informational purposes only. This document is intended exclusively for the person to whom it has been delivered, and may not be reproduced or redistributed to any other person without the prior written consent of Navega Strategies LLC (“Navega”). The information contained herein is based on Nageva’s proprietary research analytics of data obtained from third party statistical services, company reports or communications, publicly available information, or other sources, believed to be reliable. However, Navega has not verified this information, and we make no representations whatsoever as to its accuracy or completeness. Navega does not intend to provide investment advice through this document. This document is in no way an offer to sell or a solicitation of an offer to buy any securities. Investing in securities involves risk of loss, including a loss of principal, that clients should be prepared to bear. Past performance is not indicative of future results, which may vary materially. While this summary highlights important data, it does not purport to capture all dimensions of risk. The methodology used to aggregate and analyze data may be adjusted periodically. The results of previous analyses may differ as a result of those adjustments. Navega has made assumptions that it deems reasonable and used the best information available in producing any calculations herein. Statements that are nonfactual in nature, including opinions, projections and estimates, assume certain economic conditions and industry developments and constitute only current opinions that could be incorrect and are subject to change without notice. All information provided herein is as of the delivery date the document (unless otherwise specified) and is subject to modification, change or supplement in the sole discretion of Navega without notice to you. This information is neither complete nor exact and is provided solely as reference material with respect to the services offered by Navega. Information throughout this document, whether stock quotes, charts, articles, or any other statement or statements regarding market or other financial information, is obtained from sources which we and our suppliers believe reliable, but we do not warrant or guarantee the timeliness or accuracy of this information. The information presented here has not been personalized, and is not based on the financial circumstances of the recipient. This information may not be applicable to your particular financial needs, and should not, by itself, be used to make determinations regarding the purchase or sale of securities, or other investment decisions.
The model performance information presented is based on the application of Navega’s factor analysis, backtested against actual historical data. “Backtesting” is a process of objectively simulating historical performance information by applying a set of rules backward in time. The results of the application of Navega’s model do not reflect actual performance or actual historical data. Such models are prepared with the full benefit of hindsight, and it is not likely that similar results could be achieved in the future.
The model portfolios were constructed by Navega with the benefit of hindsight to illustrate certain performance metrics. The performance shown was not actually achieved by any investor. The investments in these hypothetical portfolios were selected with the full benefit of hindsight, after performance over the period shown was known. It is not likely that similar results could not be achieved in the future. The hypothetical portfolios presented here are purely illustrative, and representative only of a small sample of possible scenarios.
The projections shown do not represent actual performance, and are based on assumptions which may not occur. It is possible that the markets will perform better or worse than shown in the projections, the actual results of an investor who invests in the manner these projections suggest will be better or worse than the projections, and an investor may lose money by relying on these projections.