The Covid-19 pandemic has renewed investors' concerns about macroeconomic and financial markets prospects in China, and their potential impact on portfolio decisions. Our macro-based models suggest investors can benefit by understanding the fundamental sources of long-term real economic growth - trend growth in the labor force and total factor productivity . Assuming a rebound in economic activity to 2019 levels in the next 12-18 months, our baseline projections are consistent with Chinese equity and bond markets pricing in high uncertainty about a rather low long-term real economic growth rate of about 2% - well below the reported 6% past 10-year average rate ! Taken together, these macro trends are consistent, according to our models, with the continuation of low government bond yields and high long-term equity risk premium.
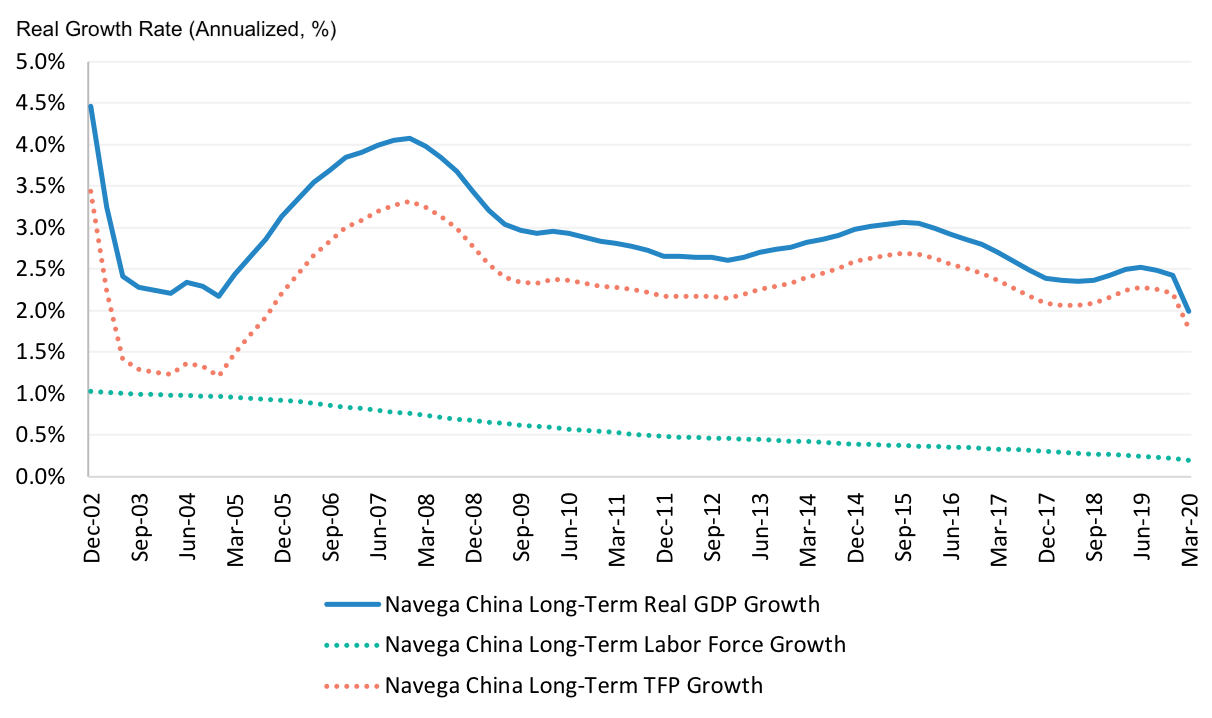
As portrayed by Exhibit 1, long-term real economic growth in China has been declining on trend since the 2008 global financial crisis according to our models, hovering in the 2.5%-3.5% range through 2016, and decreasing towards 2.5% more recently, possibly due to the impact of trade disputes and high levels of corporate debt. The 40bps decline in trend growth experienced in Q1 2020 was mainly driven by the severe -7.3% drop in real output from previous year due to lockdowns. However Exhibit 1 also shows that deeper, fundamental forces undermining economic growth have been at play - long before the pandemic. What are these forces? In our models, these forces are reflected in growth trends in the labor force and total factor productivity. Growth in the labor force has been stubbornly low over the past 20 years, driven by demographics, and has even further declined in the recent years. As for growth in total factor productivity, the main engine of economic growth in China, it has also been decreasing on trend, although remaining, so far, at higher levels compared to the rest of the world.

This continued decline in long-term real economic growth led to a rise in long-term growth uncertainty (variability). As depicted in Exhibit 2, and according to our models, long-term growth uncertainty declined from 7% around the 2008 global financial crisis (GFC) to 5.7% through 2016. Since then, it has been rising, and back to 7% in 2019. Moreover, our models help identify the sources of this uncertainty, and reveal that for the most part, growth uncertainty in China has been primarily driven by a combination of markets' pricing of doubts regarding reported official statistics and longer term trend variability, as opposed to shorter term quarter to quarter realized fluctuations. Interestingly, our models indicate growth uncertainty in China has been following a different pattern compared to G7 countries . For example, while cruising at higher levels overall compared to levels observed in G7 countries - in the current environment, uncertainty in China is more than twice the US level and 35% higher than in the UK - macro uncertainty in China dropped sharply in 2008 at the onset of the GFC, and only rose in 2009 over the year. By contrast, in all G7 countries, uncertainty increased throughout the GFC, stayed persistently high for nearly 8 years, and only declined in 2016. A possible explanation, according to our models, is that the reported growth statistics for China may have been slow to adjust during the GFC.
The main lesson for long-term investors with allocations to China is that the pandemic, ongoing trade disputes and the size of corporate debt can have a long-term impact on asset returns and portfolio decisions only to the extent they affect fundamental sources of long-term growth and growth uncertainty. Our models unveil that long-term real economic growth in China has been decreasing and trending at much lower rates compared to reported official statistics. A trend that predates the pandemic, driven by deeper, secular factors - decreasing growth in total factor productivity, and low growth in the labor force. These macro trends are consistent with Chinese markets pricing of a prolonged period of low government bond yields and high long-term expected equity returns relative to bond yields (risk premia). Going forward, investors are well advised to continue to monitor potential changes to these long-term, macro trends and trace their impact on asset returns and portfolio decisions in a consistent, systematic fashion.
This document is for informational purposes only. This document is intended exclusively for the person to whom it has been delivered, and may not be reproduced or redistributed to any other person without the prior written consent of Navega Strategies LLC (“Navega”). The information contained herein is based on Nageva’s proprietary research analytics of data obtained from third party statistical services, company reports or communications, publicly available information, or other sources, believed to be reliable. However, Navega has not verified this information, and we make no representations whatsoever as to its accuracy or completeness. Navega does not intend to provide investment advice through this document. This document is in no way an offer to sell or a solicitation of an offer to buy any securities. Investing in securities involves risk of loss, including a loss of principal, that clients should be prepared to bear. Past performance is not indicative of future results, which may vary materially. While this summary highlights important data, it does not purport to capture all dimensions of risk. The methodology used to aggregate and analyze data may be adjusted periodically. The results of previous analyses may differ as a result of those adjustments. Navega has made assumptions that it deems reasonable and used the best information available in producing any calculations herein. Statements that are nonfactual in nature, including opinions, projections and estimates, assume certain economic conditions and industry developments and constitute only current opinions that could be incorrect and are subject to change without notice. All information provided herein is as of the delivery date the document (unless otherwise specified) and is subject to modification, change or supplement in the sole discretion of Navega without notice to you. This information is neither complete nor exact and is provided solely as reference material with respect to the services offered by Navega. Information throughout this document, whether stock quotes, charts, articles, or any other statement or statements regarding market or other financial information, is obtained from sources which we and our suppliers believe reliable, but we do not warrant or guarantee the timeliness or accuracy of this information. The information presented here has not been personalized, and is not based on the financial circumstances of the recipient. This information may not be applicable to your particular financial needs, and should not, by itself, be used to make determinations regarding the purchase or sale of securities, or other investment decisions.
The model performance information presented is based on the application of Navega’s factor analysis, backtested against actual historical data. “Backtesting” is a process of objectively simulating historical performance information by applying a set of rules backward in time. The results of the application of Navega’s model do not reflect actual performance or actual historical data. Such models are prepared with the full benefit of hindsight, and it is not likely that similar results could be achieved in the future.
The model portfolios were constructed by Navega with the benefit of hindsight to illustrate certain performance metrics. The performance shown was not actually achieved by any investor. The investments in these hypothetical portfolios were selected with the full benefit of hindsight, after performance over the period shown was known. It is not likely that similar results could not be achieved in the future. The hypothetical portfolios presented here are purely illustrative, and representative only of a small sample of possible scenarios.
The projections shown do not represent actual performance, and are based on assumptions which may not occur. It is possible that the markets will perform better or worse than shown in the projections, the actual results of an investor who invests in the manner these projections suggest will be better or worse than the projections, and an investor may lose money by relying on these projections.