Despite the dramatic surge in government debt in the US - relative to GDP - our prior for long run inflation remains a rather benign rate of about 2.2%. Our prior is consistent with bond markets' pricing of our baseline scenario of continued sluggish real economic growth and of the role of US dollar denominated government debt securities as the dominant reserve assets in the world. In this context, today's low levels of US inflation rely on long-term stability of government finances, markets' perceptions of macro uncertainty, and the continued ability of the US to mine the exorbitant advantages accorded the US dollar as the leading reserve currency.
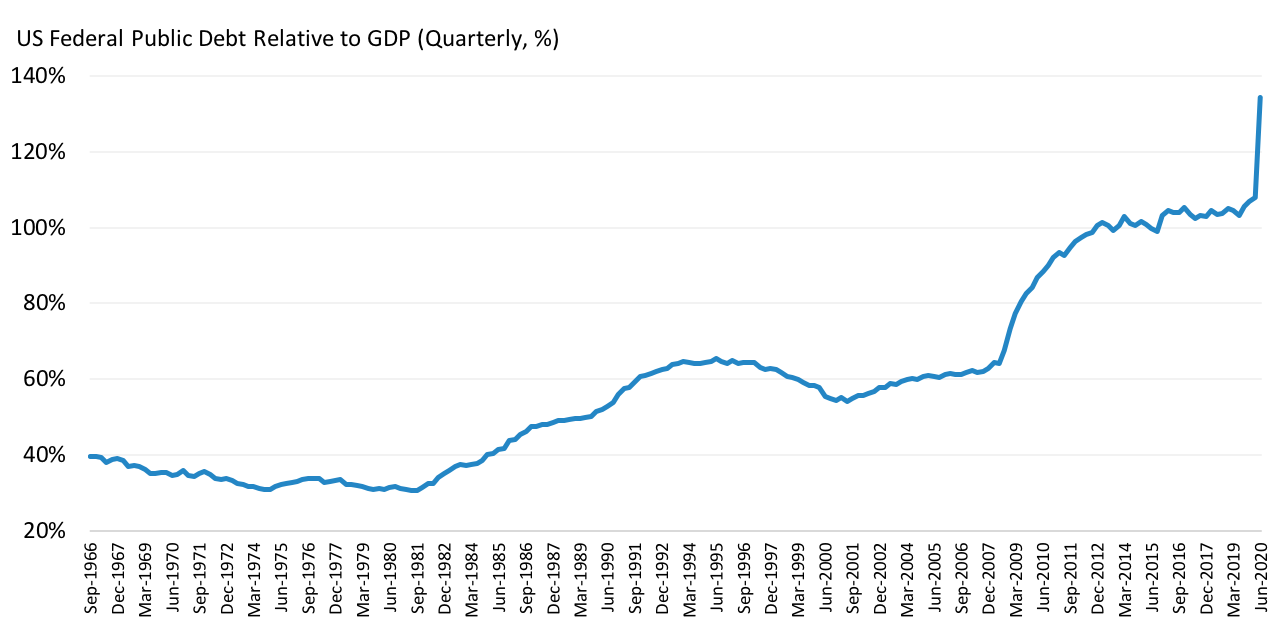
As shown in Exhibit 1, US government debt experienced a whopping 24% increase relative to GDP in the quarter ending June 30, reflecting both the expansionary fiscal policies to mitigate the economic impact of Covid-19 (accounting for a 14% increase in federal public debt), and the sharp drop in GDP (approximately 8.5%). It is no surprise that this sharp increase in government borrowing has revived investors' concern about resurgent inflation. According to basic government finance accounting and historical experience (including the 1970s oil shocks), significant increases in government debt should be balanced with future increases in government revenues -mostly taxes- and money creation. With this simple accounting, low real GDP growth implies lower revenue. Hence without major increases in tax rates, increases in money printing translates to higher inflation. Over the last 10 years, government debt grew at an annual rate of about 9.5%, while the average real economic growth rate was about 1.5%. These figures should leave us with an average annualized inflation rate of 8%, which is clearly not the actual experience of US inflation. Why has there been such a discrepancy, and what lessons should investors learn?
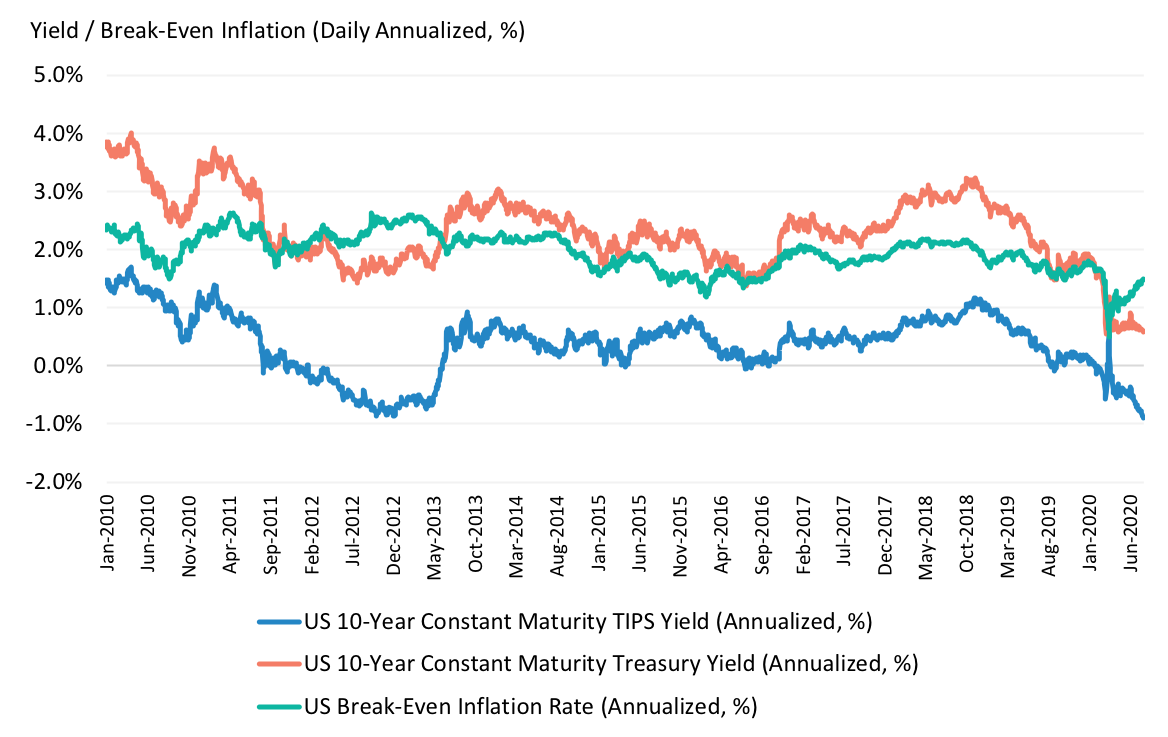
Let's start with what markets are saying. Bond markets have been shrugging off risks of significantly higher inflation, pricing in benign and lower inflation expectations. Exhibit 2 shows that since March, both the nominal and real yield on 10-year US Treasury bonds have decreased about 60bps. This leaves the breakeven inflation rate (the difference between the nominal and real yield), a gauge of markets’ long-term inflation expectations, broadly unchanged at around 1.5% and below its past 10-year average of 2%. What the decline in both real and nominal bond yields does warn us about, however, is that bond markets are pricing in lower long-term real economic growth trend and rising uncertainty about the trend.
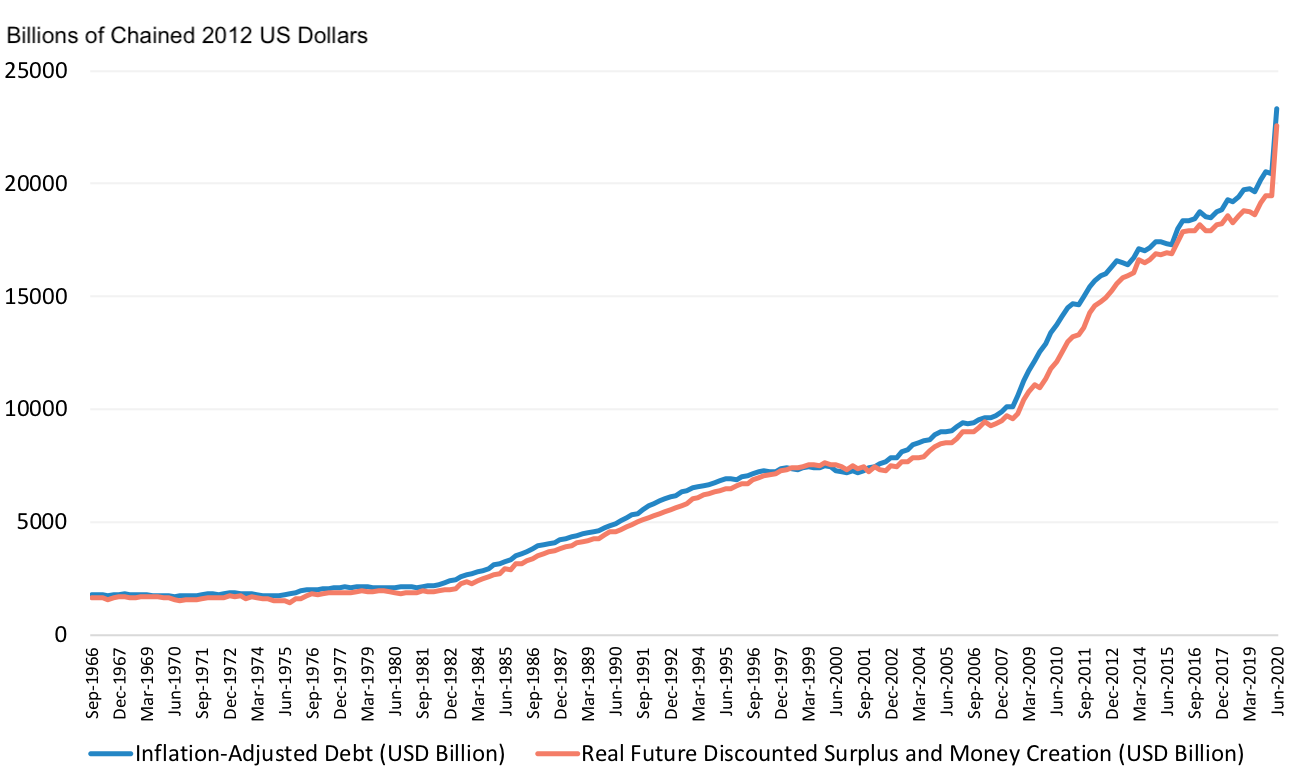
How should we think then of this apparent disconnect between bond markets pricing of low inflation and common intuition - backed by historical evidence - of unbalanced debt fueling higher inflation? Should investors safely rule out any risks to higher inflation? To understand the source of inflation risk, investors are well advised to pay attention to the interaction between markets' perceptions of long-term real economic growth uncertainty and credibility of fiscal/monetary policies. These interactions are summarized by the government budget constraint, shown in Exhibit 3. The Exhibit portrays the first principle of budget accounting: government debt, adjusted for inflation, reflects markets’ expectations of future, discounted surpluses, also adjusted for inflation. Surpluses are measured as receipts (mostly from taxes) less spending, and changes in central bank money creation. Thus, long-term inflation expectations depend on three key factors: the long-term real discount rate; markets’ views about long-term changes in nominal debt; and markets' perception of the sustainability of government spending. Of these, the long-term real discount rate is driven by long-term real trend growth and uncertainty about the trend.
Hence, to pin down long run inflation, investors need a scenario for each of the three factors. Exhibit 4 contrasts the evolution of CPI inflation from 1976 with two estimates of long run inflation rates that differ in their assumptions over two key periods: the Great Inflation until 1982, and post-global financial crisis (from 2009 to present). Both estimated inflation rate series assume investors forecast debt changes as their average over the past 10 years, and economic growth and growth uncertainty according to our model baseline forecast. However the first estimate assumes that investors trust government debt will be backed by future budget surpluses (i.e. no changes in money creation). In turn, this implies that given a level of debt, inflation is primarily driven by real discount rates. More precisely, under this scenario, inflation increases with real discount rates. By contrast, the second estimate assumes investors doubt debt can be backed by budget surpluses alone. Under this alternative scenario, changes in nominal debt are then fully compensated by changes in inflation, consistent with our earlier basic calculations.
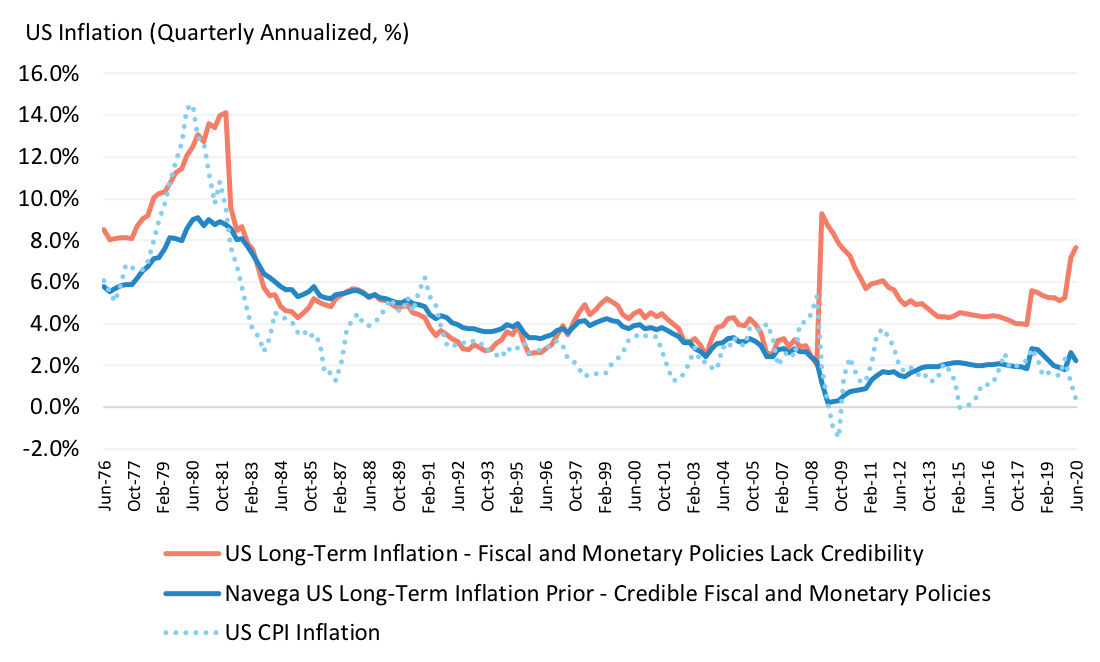
For the most part, realized inflation rates have been aligned with the first scenario, even more recently, when they have remained benign despite unprecedented increases in debt and money. One possible explanation is that investors still perceive US debt, denominated in US dollars, as the unique safe haven asset acting as insurance against acute surges in macro uncertainty, like the 2008 global financial crisis experience. Under this interpretation, US government bonds are viewed as likely to retain their position as a dominant reserve asset . In addition, our baseline scenario of lower long-term real economic growth and rising growth uncertainty, consistent with Exhibit 2, also implies the continuation of low real discount rates. These assumptions translate into a rather benign long-term inflation rate of about 2.2% per year. This estimate is indeed greater than the low 1.5% rate implied by bond markets, but still much lower than the 8% rate obtained from our basic calculations.
However investors are right to remain worried about risks of higher inflation, as markets' perceptions of debt sustainability can shift swiftly and radically. With debt growing at its current average rate of 9.5% per year, such shifts could well be triggered by persistent declines in real trend growth -a plausible Covid-19 scenario- and exacerbated by increasing geopolitical risks undermining the exorbitant privilege of the US dollar as dominant reserve currency. Exhibit 4 suggests that the 1970s high inflation experience was consistent with our alternative scenario. Indeed, persistent increases in money elusively aimed at reducing unemployment and fostering growth only fuelled government debt, without any credible backing, at a time when the US dollar's credibility as the world's leading currency was also shaken following the collapse of the Bretton Woods monetary system .
Likewise, in present times, the roots of possible higher inflation lie in the credibility of US fiscal and monetary policy and of the US dollar to remain the world's leading currency - this is the true long-term inflation risk for investors. If this credibility is lost, our baseline scenario of increasing macro uncertainty and lower growth implies that inflation could well increase to about 7.6% ! Thus, investors would be well advised to monitor government debt in the context of long run changes in long-term real economic growth and geopolitical risks to the US dollar.
This document is for informational purposes only. This document is intended exclusively for the person to whom it has been delivered, and may not be reproduced or redistributed to any other person without the prior written consent of Navega Strategies LLC (“Navega”). The information contained herein is based on Nageva’s proprietary research analytics of data obtained from third party statistical services, company reports or communications, publicly available information, or other sources, believed to be reliable. However, Navega has not verified this information, and we make no representations whatsoever as to its accuracy or completeness. Navega does not intend to provide investment advice through this document. This document is in no way an offer to sell or a solicitation of an offer to buy any securities. Investing in securities involves risk of loss, including a loss of principal, that clients should be prepared to bear. Past performance is not indicative of future results, which may vary materially. While this summary highlights important data, it does not purport to capture all dimensions of risk. The methodology used to aggregate and analyze data may be adjusted periodically. The results of previous analyses may differ as a result of those adjustments. Navega has made assumptions that it deems reasonable and used the best information available in producing any calculations herein. Statements that are nonfactual in nature, including opinions, projections and estimates, assume certain economic conditions and industry developments and constitute only current opinions that could be incorrect and are subject to change without notice. All information provided herein is as of the delivery date the document (unless otherwise specified) and is subject to modification, change or supplement in the sole discretion of Navega without notice to you. This information is neither complete nor exact and is provided solely as reference material with respect to the services offered by Navega. Information throughout this document, whether stock quotes, charts, articles, or any other statement or statements regarding market or other financial information, is obtained from sources which we and our suppliers believe reliable, but we do not warrant or guarantee the timeliness or accuracy of this information. The information presented here has not been personalized, and is not based on the financial circumstances of the recipient. This information may not be applicable to your particular financial needs, and should not, by itself, be used to make determinations regarding the purchase or sale of securities, or other investment decisions.
The model performance information presented is based on the application of Navega’s factor analysis, backtested against actual historical data. “Backtesting” is a process of objectively simulating historical performance information by applying a set of rules backward in time. The results of the application of Navega’s model do not reflect actual performance or actual historical data. Such models are prepared with the full benefit of hindsight, and it is not likely that similar results could be achieved in the future.
The model portfolios were constructed by Navega with the benefit of hindsight to illustrate certain performance metrics. The performance shown was not actually achieved by any investor. The investments in these hypothetical portfolios were selected with the full benefit of hindsight, after performance over the period shown was known. It is not likely that similar results could not be achieved in the future. The hypothetical portfolios presented here are purely illustrative, and representative only of a small sample of possible scenarios.
The projections shown do not represent actual performance, and are based on assumptions which may not occur. It is possible that the markets will perform better or worse than shown in the projections, the actual results of an investor who invests in the manner these projections suggest will be better or worse than the projections, and an investor may lose money by relying on these projections.