Our last note identified three reasons, beyond return expectations, for investors to invest in private equity. We focused on these three reasons because for both theoretical and empirical reasons, there is no separate "private equity premium" for investors to exploit. Investors in private equity should avoid being seduced by stories of high expected returns because fundamentally, private equity is just like every other active management strategy.
However, many otherwise sober-minded investors still allow expectations of high private returns to drive their private equity allocations. The line of argument is as follows: first, these investors represent so-called “patient capital” with long investment horizons. Second, relative to public equity, private equity has an illiquidity premium. Thus, because these investors represent patient capital, they can allocate capital and reap the long-term illiquidity premium. There are empirical and theoretical reasons why investors should be skeptical of this line of reasoning.
To understand why, let’s return to the simple framework from our earlier note. Behind this framework is the following premise: an investment in private equity is an investment in equity . If we accept this basic premise, then our framework suggests the following: private equity returns (and fees) implicitly have four main components:
Return smoothing
Small cap and value exposure
Leverage, and
General partner alpha
Exhibit 1 applies this structure to look at aggregate private equity returns versus the smoothed returns to the Navega Liquid PE Index - a leveraged small cap and value index. All returns are evaluated net of fees. The exhibit shows that historically, simply levering a small cap value index produced the same average return (net of fees). This analysis shows that aggregate private equity returns have been driven by the combination of leverage and exposure to the small cap premium. In practical terms, investors need to form views on the level and direction of the long-term small cap value premium. As pointed out in earlier note, the small cap value premium reflects exposure to long run macroeconomic risk.
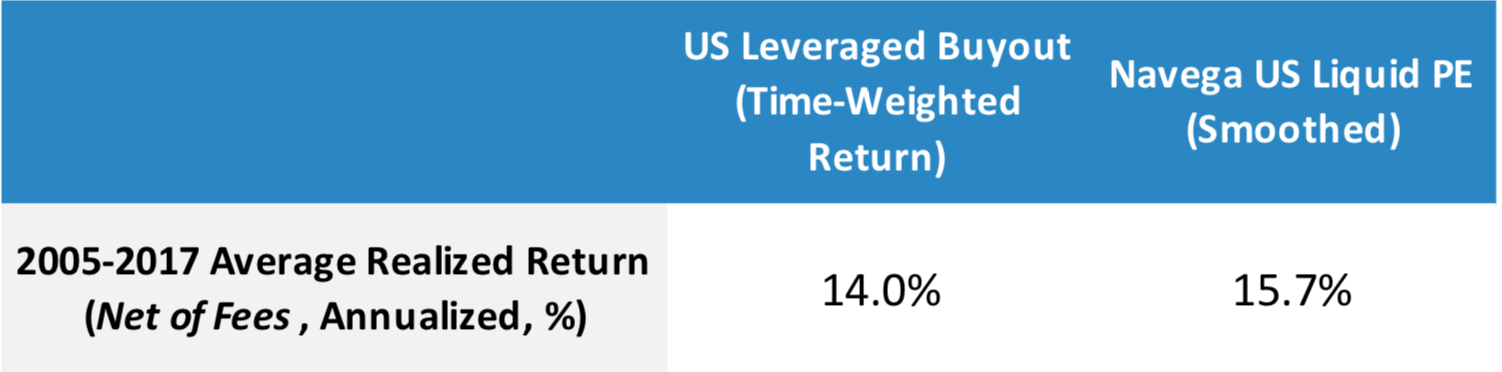
A second important point emerges from the figures in Exhibit 1: historically, the aggregate alpha from private equity to investors has been basically zero. In practical terms, this point means that investors should treat their private equity managers just like any other active manager and evaluate these managers in terms of their skill in producing alpha, not solely the production of total returns.
Theoretically there are three reasons that we should not be surprised by these results. First, it is a matter of simple arithmetic that the net alpha produced by active managers is less than zero. Simply adding the cap-weighted returns on all managers (passive and active) yields the overall market return. After subtracting fees, we get that the aggregate net alpha is less than zero. The case of private equity returns is no different.
Second, in a capital market equilibrium there can be no distinct aggregate private equity premium — beyond what is captured by the small cap premium and after adjusting for leverage. To see this, consider the following simple thought-experiment: suppose all public equity was converted to private equity overnight, including the required change in financing structure. Would this mean that expected returns on the former public equity, accounting for the change in financing structure, suddenly increased from one day to the next simply because it is held in a less liquid investment vehicle? We are highly skeptical. .
Finally, the idea that in the long run private equity receives a liquidity premium beyond what is priced into the bond premium and underlying cash-flows' long-term growth risk also strikes us as a stretch. Precisely, investments in private equity represent “patient capital” and are held over long horizons. In other words, the capital allocated to private equity in these long run investors’ is not required to finance short-term liquidity and spending needs. Thus, private equity held over these long investment horizons is not exposed to illiquidity risk. Rather, as highlighted earlier, it is exposed to the same long horizon risk as its public equity counterpart, in turn primarily driven by changes in real economic growth trends according to our models. In other words, there is no illiquidity premium in private equity, rather, the private equity premium entirely reflects exposure to long horizon real economic growth risk.
In our view there are four implications for investors. First, they should think very carefully about what specific investment problem they are trying to solve with their private equity allocations. Second, they should critically evaluate the costs of all potential investment solutions to those problems. Third, they should evaluate the expected alpha from their private equity managers versus alternative sources of alpha, and carefully consider the relative costs of each alternative. Finally, they should identify the skills that differentiate private equity managers in alpha production, and evaluate their managers on the basis of those skills — in other words, investors should pay for alpha, not beta.
This document is for informational purposes only. This document is intended exclusively for the person to whom it has been delivered, and may not be reproduced or redistributed to any other person without the prior written consent of Navega Strategies LLC (“Navega”). The information contained herein is based on Nageva’s proprietary research analytics of data obtained from third party statistical services, company reports or communications, publicly available information, or other sources, believed to be reliable. However, Navega has not verified this information, and we make no representations whatsoever as to its accuracy or completeness. Navega does not intend to provide investment advice through this document. This document is in no way an offer to sell or a solicitation of an offer to buy any securities. Investing in securities involves risk of loss, including a loss of principal, that clients should be prepared to bear. Past performance is not indicative of future results, which may vary materially. While this summary highlights important data, it does not purport to capture all dimensions of risk. The methodology used to aggregate and analyze data may be adjusted periodically. The results of previous analyses may differ as a result of those adjustments. Navega has made assumptions that it deems reasonable and used the best information available in producing any calculations herein. Statements that are nonfactual in nature, including opinions, projections and estimates, assume certain economic conditions and industry developments and constitute only current opinions that could be incorrect and are subject to change without notice. All information provided herein is as of the delivery date the document (unless otherwise specified) and is subject to modification, change or supplement in the sole discretion of Navega without notice to you. This information is neither complete nor exact and is provided solely as reference material with respect to the services offered by Navega. Information throughout this document, whether stock quotes, charts, articles, or any other statement or statements regarding market or other financial information, is obtained from sources which we and our suppliers believe reliable, but we do not warrant or guarantee the timeliness or accuracy of this information. The information presented here has not been personalized, and is not based on the financial circumstances of the recipient. This information may not be applicable to your particular financial needs, and should not, by itself, be used to make determinations regarding the purchase or sale of securities, or other investment decisions.
The model performance information presented is based on the application of Navega’s factor analysis, backtested against actual historical data. “Backtesting” is a process of objectively simulating historical performance information by applying a set of rules backward in time. The results of the application of Navega’s model do not reflect actual performance or actual historical data. Such models are prepared with the full benefit of hindsight, and it is not likely that similar results could be achieved in the future.
The model portfolios were constructed by Navega with the benefit of hindsight to illustrate certain performance metrics. The performance shown was not actually achieved by any investor. The investments in these hypothetical portfolios were selected with the full benefit of hindsight, after performance over the period shown was known. It is not likely that similar results could not be achieved in the future. The hypothetical portfolios presented here are purely illustrative, and representative only of a small sample of possible scenarios.
The projections shown do not represent actual performance, and are based on assumptions which may not occur. It is possible that the markets will perform better or worse than shown in the projections, the actual results of an investor who invests in the manner these projections suggest will be better or worse than the projections, and an investor may lose money by relying on these projections.