Last week’s release of US CPI figures caught market participants by surprise. The monthly increase of 0.8% in April was drastically out of line relative to expectations, which had been centered at 0.2%. Many pundits suggested that the seemingly dramatic surge in prices “caused” the equity market to sell off. The panic commentary raises three questions: first, should investors dramatically increase their expectations for long-term inflation? Second, is it plausible that equity market valuations were so radically affected by short-term inflation news? Finally, what data should investors look at to form views about long-term inflation? This note will focus on the first of these questions; subsequent notes will address the second two.
Our view is that investors should not be radically adjusting their views about long-term inflation, despite the hyperventilating from market commentators. More specifically, any commentary about inflation that relies on equity market valuations should be discounted heavily. There are two reasons for this. First, equity daily volatility is higher than bond market volatility and is notoriously difficult to interpret. Second, and more importantly, the bond market produces daily forecasts of long-term inflation. Pundits, market commentators and investors should use the bond market as an indicator of inflation expectations rather than the equity market.
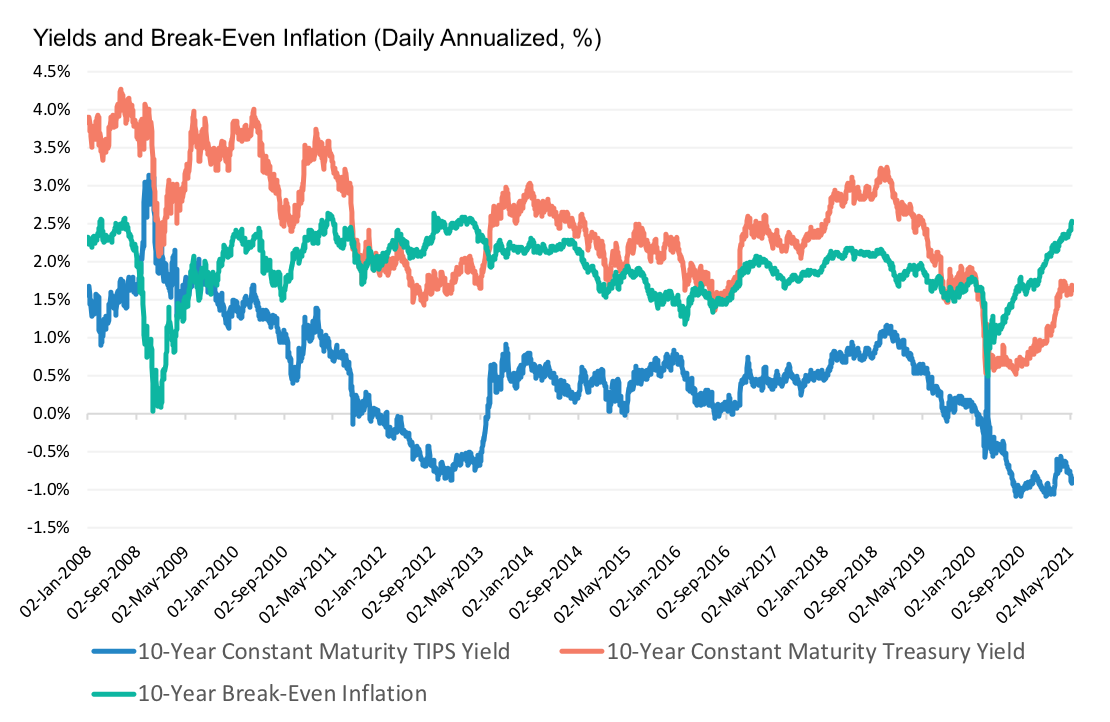
So, what does the bond market tell us about inflation expectations? The usual market proxy for inflation expectations is the difference between nominal and real bond yields. Since the beginning of 2021, the spread between US 10-year nominal and real bonds (one measure of market expectations of 10-year inflation) has risen from 2.01% on January 4, 2021 to 2.54% on May 13, 2021. According to this measure, inflation expectations have increased about 53 basis points since the beginning of the year.
Digging into this in a little more detail, we see that the rise in inflation expectations has been fairly steady. This point is summarized in Exhibit 1. The exhibit shows real and nominal US 10-year bond yields and their difference from January 2nd, 2008 to May 13th, 2021. According to the exhibit, after falling sharply to 0.5% around the start of the first lockdown (March 19th, 2020), inflation expectations priced by bond markets have been recovering gradually through 2020, and then continued to grow at similar rates since January. Importantly, inflation expectations were already increasing before last week’s inflation release. Exhibit 1 also helps frame the recent pick-up in a longer term perspective: since the 2008 Global Financial Crisis, inflation expectations have been hovering between 1.5% and 2.5%.
Other commentators have pointed out that many of the observed price increases can be justified as coming from short-term shortages (e.g. semiconductors, automobiles) and adjustment to post-pandemic life. This line of reasoning suggests that expectations about real growth could play a role in forming expectations about inflation. The linkage between real growth, real growth risk and inflation will be explored more thoroughly in a future note.
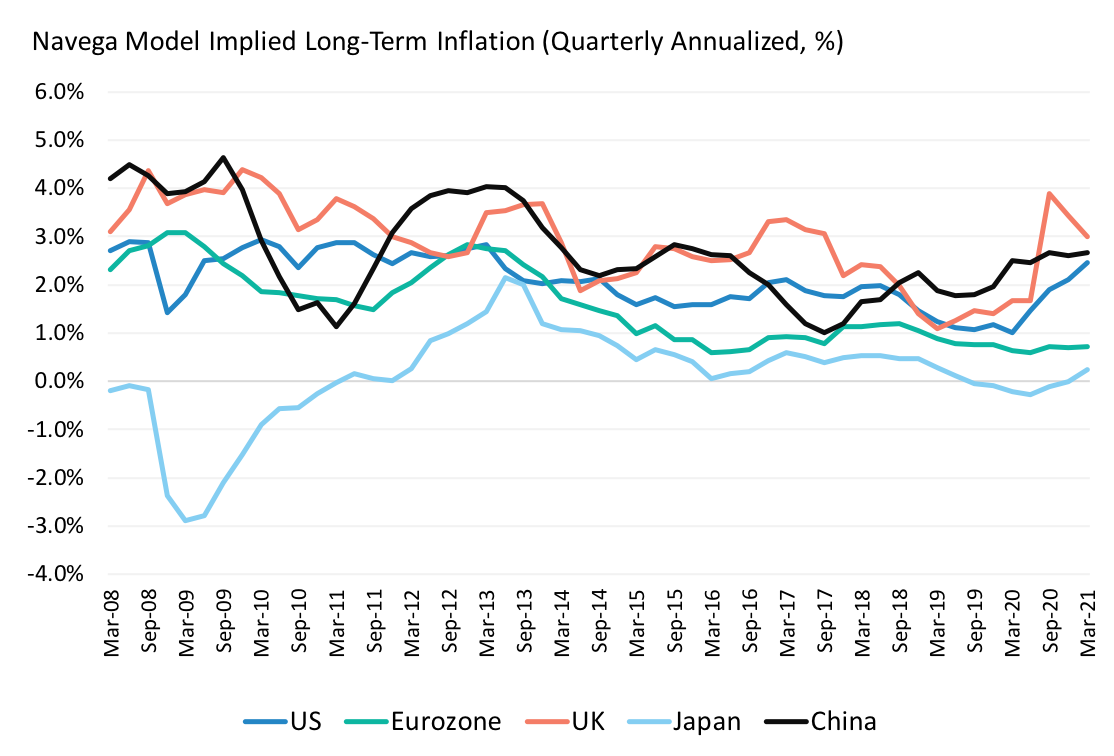
On balance, our model’s expectations for US long-term inflation have increased modestly since January, following a year of depressed and below trend rates. This point is illustrated in Exhibit 2. The exhibit shows the time series of our model’s long-term inflation forecasts since 2008. In addition to US long-term inflation expectations, the exhibit also shows our model’s expectations for the Eurozone, the UK, Japan, and China. There are two key points in the exhibit. First, inflation expectations are higher in the US than in the Eurozone and Japan. Second, with the exception of the Eurozone - lagging in its economic recovery - inflation expectations have been gradually ratcheting up everywhere.
Our moderate changes in inflation expectations (particularly in view of recent announcements) should not be taken to mean that either (a) we don’t think that there are risks to higher inflation, nor (b) that we think that those risks are unchanged. In our model, long-term inflation expectations are driven by market prices, real economic growth, and government finances. A future note will discuss the connections between government finances, real growth, and inflation expectations in more detail.
This document is for informational purposes only. This document is intended exclusively for the person to whom it has been delivered, and may not be reproduced or redistributed to any other person without the prior written consent of Navega Strategies LLC (“Navega”). The information contained herein is based on Nageva’s proprietary research analytics of data obtained from third party statistical services, company reports or communications, publicly available information, or other sources, believed to be reliable. However, Navega has not verified this information, and we make no representations whatsoever as to its accuracy or completeness. Navega does not intend to provide investment advice through this document. This document is in no way an offer to sell or a solicitation of an offer to buy any securities. Investing in securities involves risk of loss, including a loss of principal, that clients should be prepared to bear. Past performance is not indicative of future results, which may vary materially. While this summary highlights important data, it does not purport to capture all dimensions of risk. The methodology used to aggregate and analyze data may be adjusted periodically. The results of previous analyses may differ as a result of those adjustments. Navega has made assumptions that it deems reasonable and used the best information available in producing any calculations herein. Statements that are nonfactual in nature, including opinions, projections and estimates, assume certain economic conditions and industry developments and constitute only current opinions that could be incorrect and are subject to change without notice. All information provided herein is as of the delivery date the document (unless otherwise specified) and is subject to modification, change or supplement in the sole discretion of Navega without notice to you. This information is neither complete nor exact and is provided solely as reference material with respect to the services offered by Navega. Information throughout this document, whether stock quotes, charts, articles, or any other statement or statements regarding market or other financial information, is obtained from sources which we and our suppliers believe reliable, but we do not warrant or guarantee the timeliness or accuracy of this information. The information presented here has not been personalized, and is not based on the financial circumstances of the recipient. This information may not be applicable to your particular financial needs, and should not, by itself, be used to make determinations regarding the purchase or sale of securities, or other investment decisions.
The model performance information presented is based on the application of Navega’s factor analysis, backtested against actual historical data. “Backtesting” is a process of objectively simulating historical performance information by applying a set of rules backward in time. The results of the application of Navega’s model do not reflect actual performance or actual historical data. Such models are prepared with the full benefit of hindsight, and it is not likely that similar results could be achieved in the future.
The model portfolios were constructed by Navega with the benefit of hindsight to illustrate certain performance metrics. The performance shown was not actually achieved by any investor. The investments in these hypothetical portfolios were selected with the full benefit of hindsight, after performance over the period shown was known. It is not likely that similar results could not be achieved in the future. The hypothetical portfolios presented here are purely illustrative, and representative only of a small sample of possible scenarios.
The projections shown do not represent actual performance, and are based on assumptions which may not occur. It is possible that the markets will perform better or worse than shown in the projections, the actual results of an investor who invests in the manner these projections suggest will be better or worse than the projections, and an investor may lose money by relying on these projections.