Developed equity and bond market gyrations are primarily pricing in a continuation of macro uncertainty – a delayed economic recovery. Despite the dramatic surge in commodities prices over the past month led by the war in Ukraine and heavy economic sanctions imposed on Russia, long-term inflation expectations in developed economies still remain rather benign, as priced by their bond markets and our models. Going forward, long-term investors are well advised to focus on the (fiscal and monetary) policy responses to the crisis, and their perceived impact on the long-term drivers of real GDP growth - total factor productivity (TFP) and labor force growth - and inflation (government finances).
Exhibit 1 portrays the recent evolution of the US 10-year constant maturity nominal and real (TIPS) government bond yields, and their difference – the 10-year breakeven inflation rate, a market implied gauge of long-term inflation expectations. As depicted by the Exhibit, following Russia's intrusion into Ukraine, breakeven inflation increased from 254bps on February 25th to 294bps on March 11th. Since then, it has remained broadly unchanged. Interestingly, this 40bps increase incurred in the breakeven inflation rate was primarily driven by a decline in real yields. Indeed, over the same period, the 10-year TIPS yield decreased 37bps from -57bps to - 94bps, while the 10-year nominal treasury yield only increased 3bps, from 197bps to 200bps. The nominal yield even declined, to 174bps, through the first week following Russia's attack on Ukraine. As of March 25th, both the nominal and real yield have increased by about the same amount, reflecting the Federal Reserve decision and future plans to raise its refinancing rate. Real yields are now back at their pre-war level.

According to our models, the recent gyrations in US bond markets are consistent with markets’ pricing of high levels of US macro growth uncertainty, as Exhibit 2 illustrates. Long-term real GDP growth uncertainty increased significantly following the pandemic, and has remained stubbornly high compared to historical standards through 2021. As shown in the Exhibit, the recent, continued improvements in long-term growth trend led to a short-lived decline in macro uncertainty at the start of the year. However, the war in Ukraine has revived this uncertainty, casting renewed doubts about the speed of recovery in real economic growth.

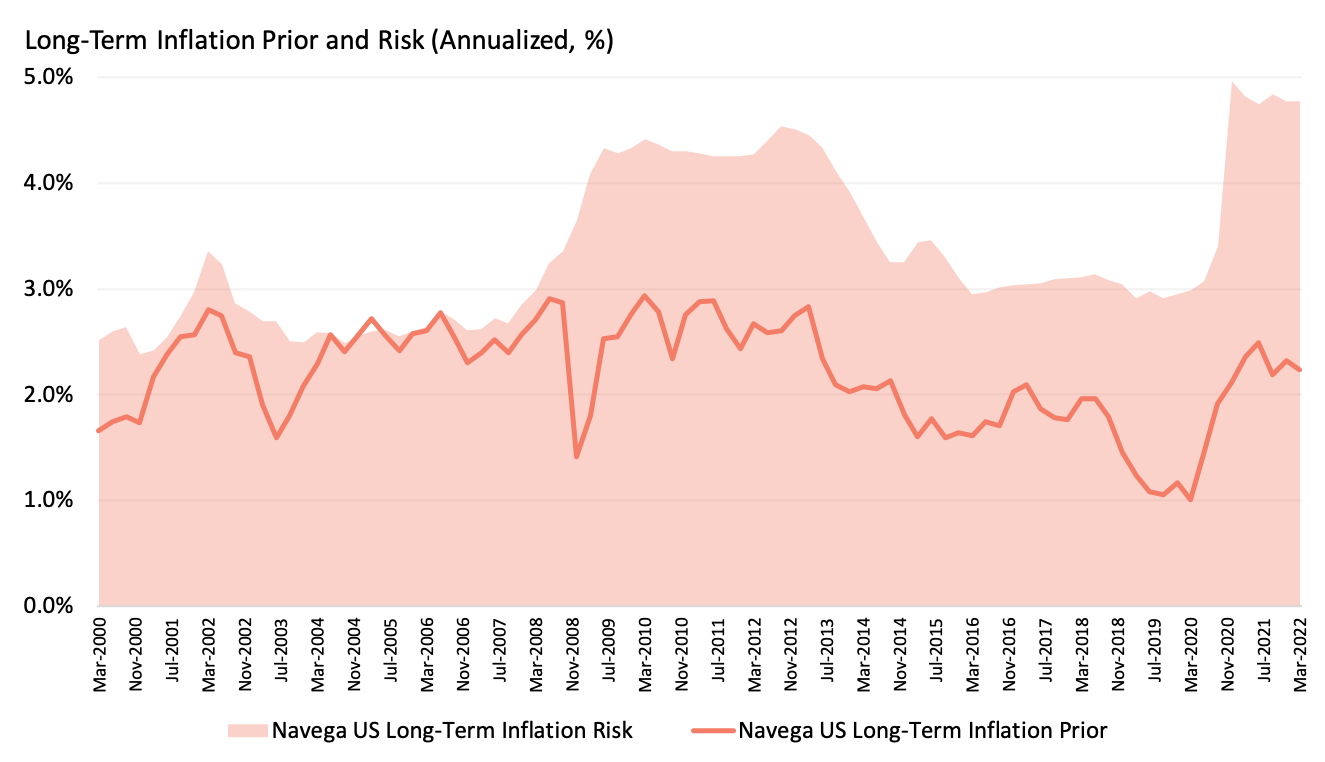
Not surprisingly, Exhibit 3 shows that our model implied prior for long-term inflation continues to be low, at 2.2%, barely above the Federal Reserve long-term target rate. Our model implied prior is consistent with the trend in bond markets pricing and so far, unchanged levels of debt-to-gdp. Nonetheless, our models also indicate that even though long-term inflation expectations are balanced, inflation risk significantly increased through the pandemic and continues to remain elevated compared to historical standards.
Interestingly, these macro and market trends have not been specific to the US. According to our models, other major developed economies such as the UK, Eurozone, and Japan also experienced similar trends in real and nominal bond markets and continuation of high macro growth uncertainty.
What next for macro and markets trends? In the shorter term, the current geopolitical crisis is likely to weigh-in on both growth and inflation prospects. A recent study by the OECD projects that, relative to its baseline forecasts , global real GDP growth could decline as much as 100bps in the coming year, and inflation could increase 250bps, globally. In the longer run though, our models suggest investors are well advised to pay close attention to mitigating policies to help curb the impact of the crisis – fiscal and monetary – and their impact on the fundamental, long-term drivers of growth and inflation. In the case of real economic growth, our models indicate that these drivers are total factor productivity (TFP) and labor force growth. As for long-term inflation, what matters is how well balanced government finances are perceived to be in the long run. In turn, the government budget balance also depends on long-term growth prospects. In the particular case of the US, given the privileged status of USD denominated assets as world’s dominant reserve assets, expectations of long-term growth relative to the rest of the world also matter.
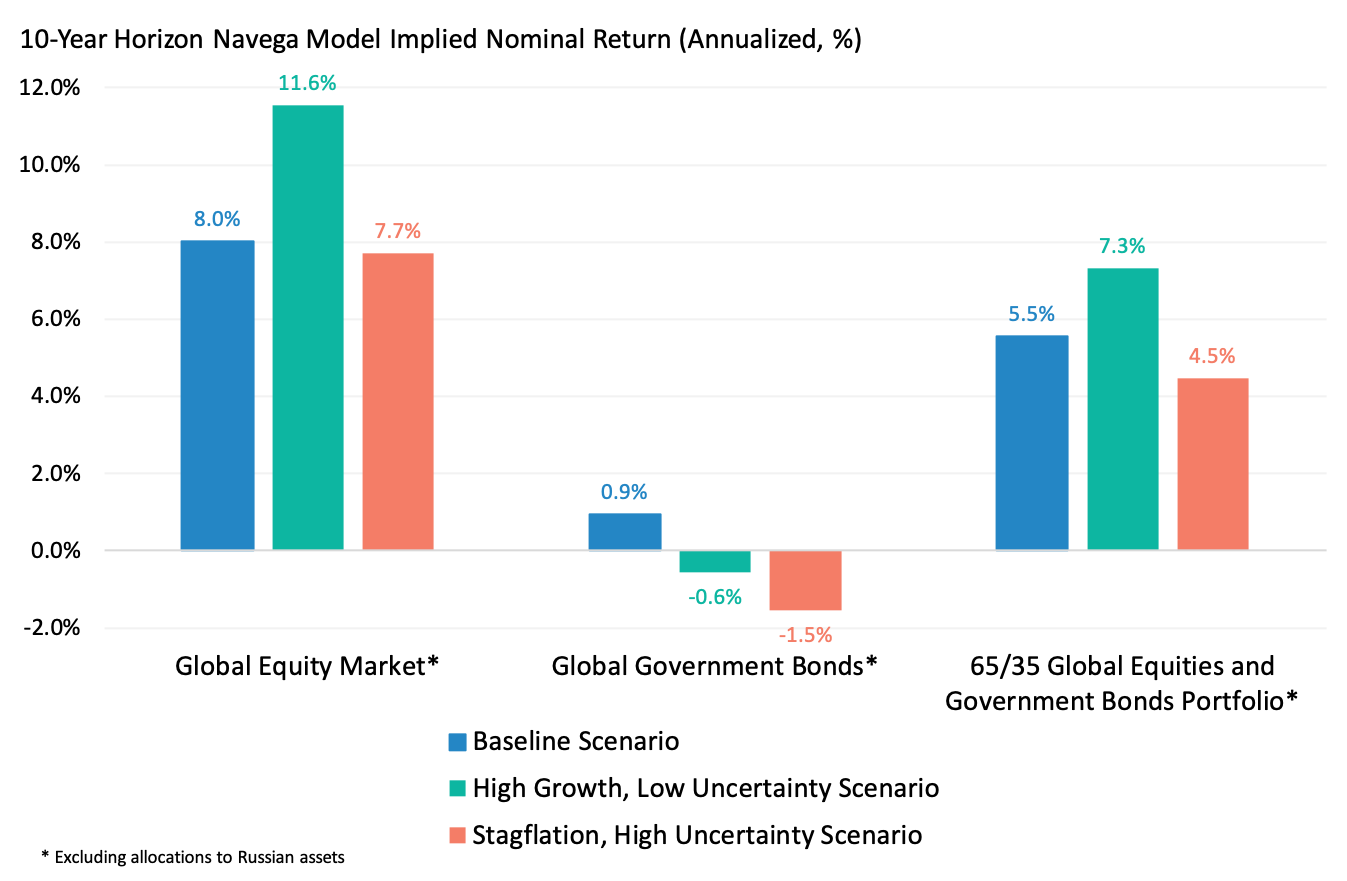
For example, suppose well targeted government policies, focused on alleviating the impact from higher key commodities prices (primarily oil, gas, wheat and maize), especially on lower income households, help lead a faster recovery in real economic growth with no changes to long-term inflation expectations. Under this scenario, assuming that in the next 10 years, global long-term real GDP growth reverts back to its pre-2008 global financial crisis level (i.e. about a 100bps increase in trend growth relative to our baseline), Exhibit 4 shows that global (nominal) equity returns would increase from 8% (our baseline) to 11.6% per year, on average over the next 10 years. Global (nominal) government bond returns would decline from 0.9% (our baseline) to -0.6% on average. On balance, nominal returns to a 65/35 global equities and bonds portfolio would increase from 5.5% (our baseline) to 7.3% per year on average.
Alternatively, should the policies prove insufficient to limit the impact on growth and prices, a worst case scenario could envision stagflation with persistently high uncertainty about the time to recovery. More precisely, under this scenario, long-term global economic growth expectations would deteriorate further for longer (a 100bps decline relative to our baseline over the next 10 years). At the same time, inflation expectations would increase significantly (about 450bps over the next 10 years), to compensate for persistently higher debt-to-GDP ratios due to inefficient expansionary measures. In turn, according to Exhibit 4, global (nominal) equity returns would barely decrease, from 8% (our baseline) to 7.7% per year on average. Global (nominal) government bond returns would take a much greater hit, declining from 0.9% (our baseline) to -1.5% per year on average. In turn, nominal returns to a 65/35 global equities and bonds portfolio would suffer significant losses, declining on average from 5.5% (our baseline) to 4.5% per year.
This document is for informational purposes only. This document is intended exclusively for the person to whom it has been delivered, and may not be reproduced or redistributed to any other person without the prior written consent of Navega Strategies LLC (“Navega”). The information contained herein is based on Nageva’s proprietary research analytics of data obtained from third party statistical services, company reports or communications, publicly available information, or other sources, believed to be reliable. However, Navega has not verified this information, and we make no representations whatsoever as to its accuracy or completeness. Navega does not intend to provide investment advice through this document. This document is in no way an offer to sell or a solicitation of an offer to buy any securities. Investing in securities involves risk of loss, including a loss of principal, that clients should be prepared to bear. Past performance is not indicative of future results, which may vary materially. While this summary highlights important data, it does not purport to capture all dimensions of risk. The methodology used to aggregate and analyze data may be adjusted periodically. The results of previous analyses may differ as a result of those adjustments. Navega has made assumptions that it deems reasonable and used the best information available in producing any calculations herein. Statements that are nonfactual in nature, including opinions, projections and estimates, assume certain economic conditions and industry developments and constitute only current opinions that could be incorrect and are subject to change without notice. All information provided herein is as of the delivery date the document (unless otherwise specified) and is subject to modification, change or supplement in the sole discretion of Navega without notice to you. This information is neither complete nor exact and is provided solely as reference material with respect to the services offered by Navega. Information throughout this document, whether stock quotes, charts, articles, or any other statement or statements regarding market or other financial information, is obtained from sources which we and our suppliers believe reliable, but we do not warrant or guarantee the timeliness or accuracy of this information. The information presented here has not been personalized, and is not based on the financial circumstances of the recipient. This information may not be applicable to your particular financial needs, and should not, by itself, be used to make determinations regarding the purchase or sale of securities, or other investment decisions.
The model performance information presented is based on the application of Navega’s factor analysis, backtested against actual historical data. “Backtesting” is a process of objectively simulating historical performance information by applying a set of rules backward in time. The results of the application of Navega’s model do not reflect actual performance or actual historical data. Such models are prepared with the full benefit of hindsight, and it is not likely that similar results could be achieved in the future.
The model portfolios were constructed by Navega with the benefit of hindsight to illustrate certain performance metrics. The performance shown was not actually achieved by any investor. The investments in these hypothetical portfolios were selected with the full benefit of hindsight, after performance over the period shown was known. It is not likely that similar results could not be achieved in the future. The hypothetical portfolios presented here are purely illustrative, and representative only of a small sample of possible scenarios.
The projections shown do not represent actual performance, and are based on assumptions which may not occur. It is possible that the markets will perform better or worse than shown in the projections, the actual results of an investor who invests in the manner these projections suggest will be better or worse than the projections, and an investor may lose money by relying on these projections.