The solvency issues of US public defined benefit plans are well-documented . Extraordinary investment performance in 2020 and 2021 combined with generous Federal funding have certainly relieved some of the funding pressures, in part by compensating for low contribution rates for the previous decade. However, here are five reasons and seven charts that show why investment performance alone is unlikely to provide sustainable relief. At a minimum, public pension funds should regularly use scenario analysis, and develop contingency plans based on those analyses. Better would be a careful re-examination of the process used to set target investment returns .
Asset returns depend on the path of real economic growth: historically, economies that have experienced higher long-term growth have also experienced higher realized real equity returns. Thus, the starting point for any long-term investment problem should be a view on long-term real growth .
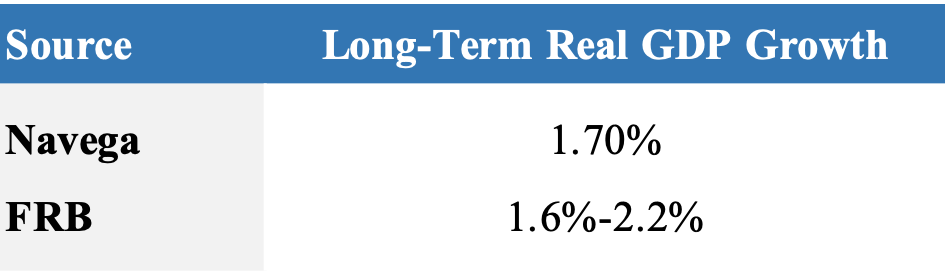
Exhibit 1 shows two views of long-term real growth - Navega’s and the Federal Reserve System’s. The Navega outlook is driven by the standard model of real economic growth. According to our models, US long-term real growth is around 1.7%. This figure is at the lower end of the Fed’s range of 1.7% to 1.9% . Importantly, all of these figures are well below the average real growth rate of approximately 3.0% observed between 1990 and 2007.
Expected long run equity returns depend on both the level of real growth and the level of uncertainty about long run growth. Realized equity returns (i.e., the returns experienced by investors) depend on changes in growth uncertainty and growth expectations. Real growth drives equity cash flows, while growth uncertainty drives discount rates.
Exhibit 2 plots our estimate of growth uncertainty from 1990 through June 2022. As is evident from the exhibit, growth uncertainty is currently higher than its long-term average. And expected long-term growth has trended down since before the Global Financial Crisis of 2007-8.
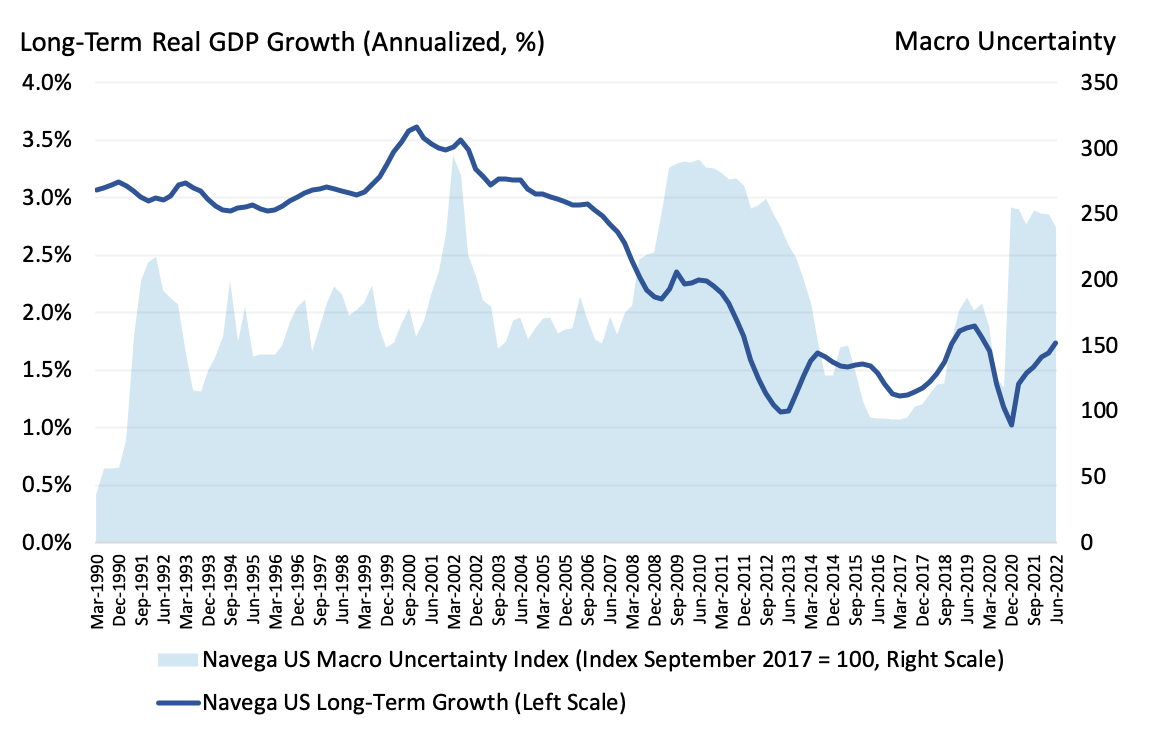
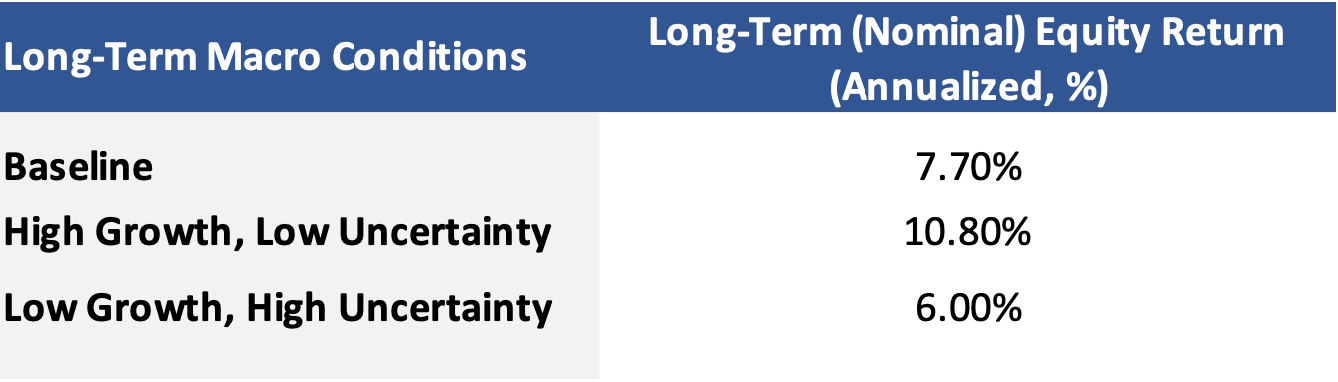
Exhibit 3 shows the levels of expected equity total returns conditioned on three levels of expected long-term real growth and growth uncertainty: (a) Navega’s baseline scenario (see Exhibit 1); (b) high growth with low uncertainty, and c) low growth with high uncertainty. Under these scenarios, expected total equity nominal returns range from 6.0% to 10.8%. These expected returns are well below the average return of 12.5% observed between 2012 and 2022. Exhibit 3 also shows the important role of real growth and growth uncertainty in determining expected long-term nominal equity returns.
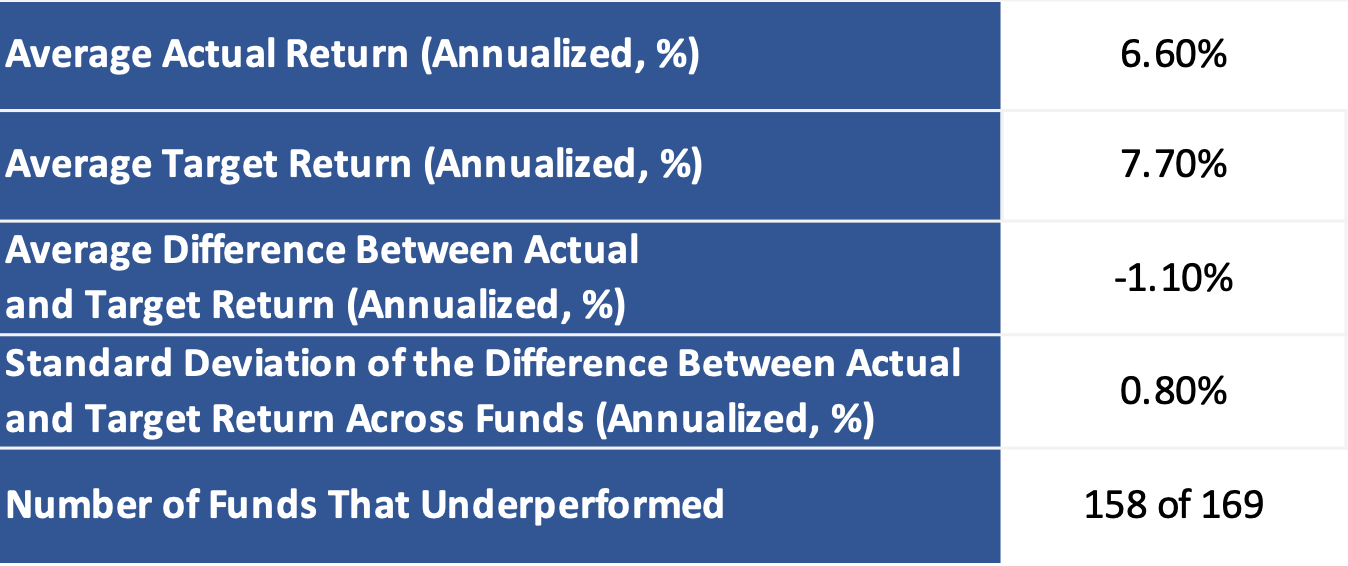
Public pension funds make asset allocation decisions on the basis of their target return. Over the last two decades, public funds actual investment performance has trailed their target returns by about 100 basis points. Indeed, over the period 2001-2021, only 11 of 169 public funds met or outperformed their target return on a cumulative basis. This point is illustrated in exhibit 4. The exhibit suggests that over the past 20 years, target returns have been too high .
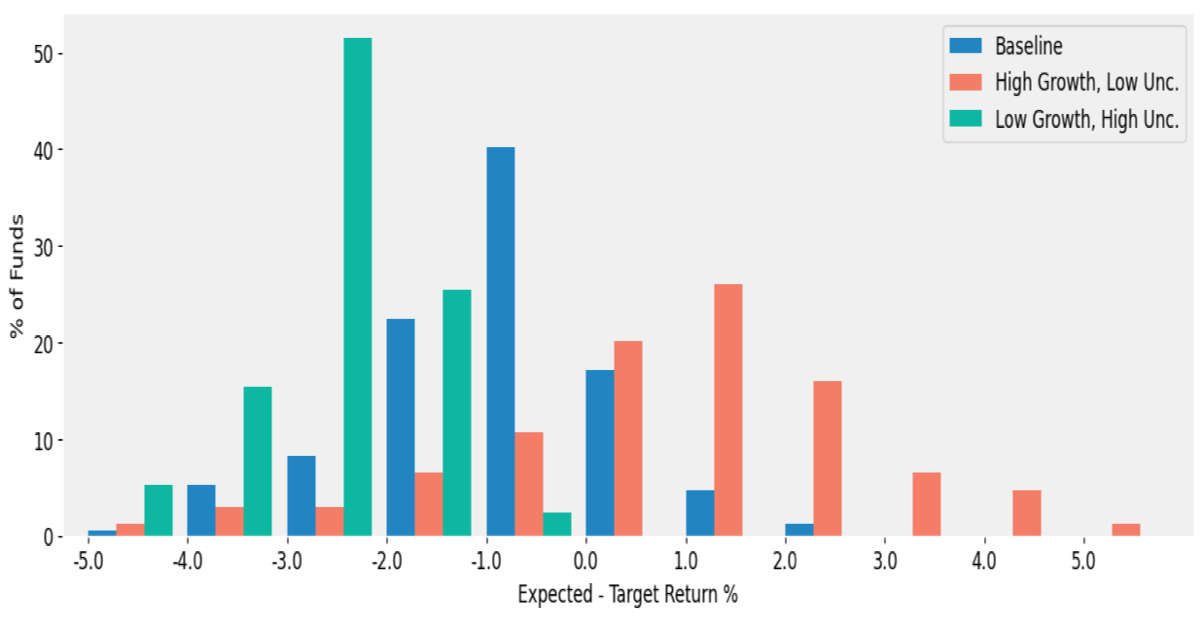
What about projected performance? Exhibit 5 shows the projected distribution of public fund performance relative to their target returns on a 10-year forward basis. The analysis shows the impact on projected performance of three different scenarios for long-term growth and growth uncertainty. Only in the high real growth scenario are the majority of funds projected to meet or outperform their target .
The main reason that funds have underperformed their targets is that target returns have been slow to adjust. To give a simple example, had funds kept a constant risk premium, and adjusted return targets with US Treasury rates, then 112 out of 169 funds would have achieved their targets over the 21 year time period . (The process in this example has the benefits of being responsive to market conditions and being straightforward to calculate).
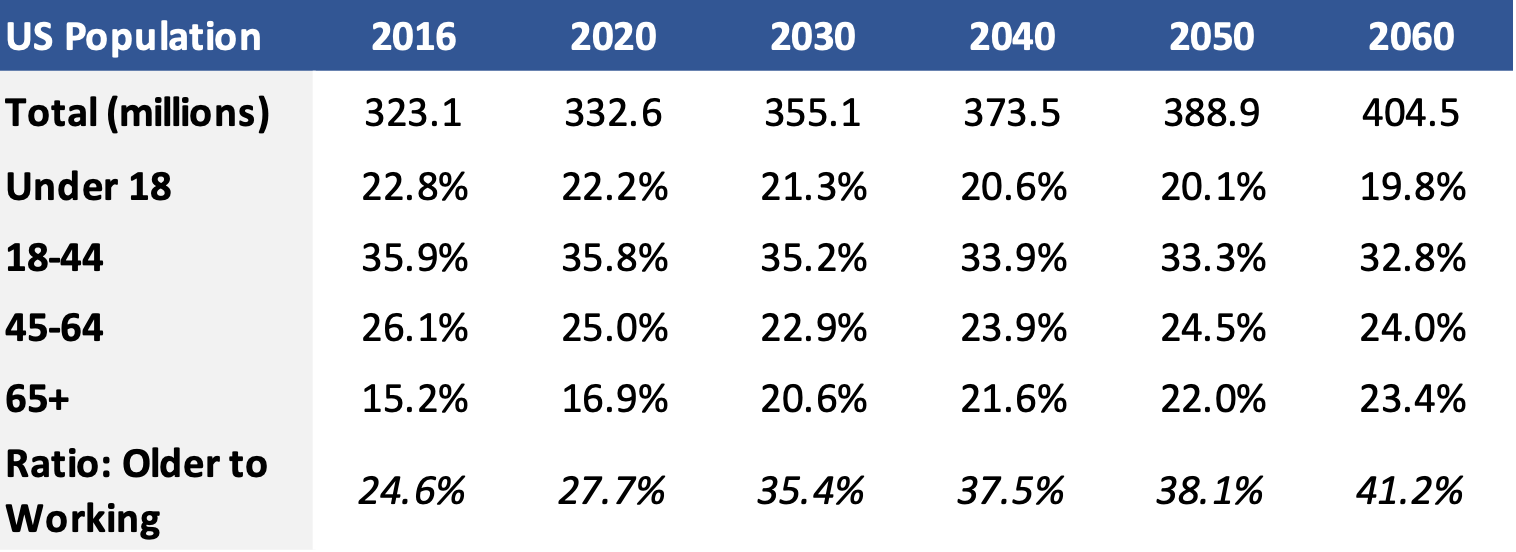
Why is it unlikely that real growth will go back to its pre-2005 trend? The two main drivers of real growth are growth in hours worked and growth in total factor productivity (TFP). Growth in hours worked depends in turn on the growth of the potential labor force. The simplest way to understand this point is through the dependency ratio (the ratio of retired workers to those currently working). Exhibit 6 shows that the US dependency ratio has increased slightly since 2016, and is projected to increase substantially through 2060, i.e. there are projected to be fewer working age people relative to retired people. Hence, it is reasonable to project that hours worked will also grow at a slower rate over the long term . This issue is particularly acute for public sector workers: since 2009, public sector employment growth has been at best flat, whereas private sector employment has increased at an annual rate of 1.1% . The bottom line is that relatively fewer people working makes it more challenging to finance benefits for retirees.
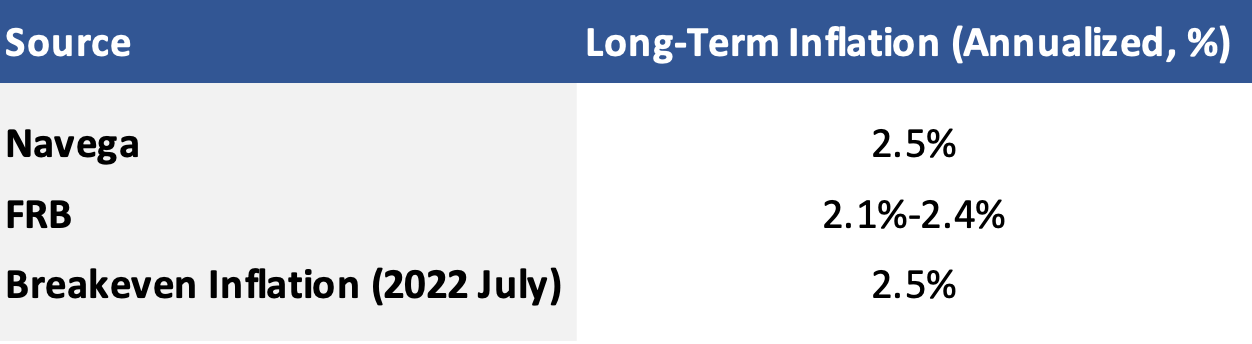
It goes without saying that observed inflation rates since the beginning of 2021 have been quite high relative to the experience between 1990 and 2019. However, long-term inflation projections are much more benign. Exhibit 7 compares Navega’s long-term inflation forecast with the Fed’s and the bond market’s (the spread between nominal and real 10-year bond yields).
Obviously, the long-term forecasts are well below the levels of observed inflation in 2022. A substantial part of the explanation for these differences lies in the distinction between supply- and demand-side effects . To the extent that supply-side tensions dissipate, then demand-side effects would lead to the long run figures in the Exhibit.
The distinction between realized (actual) short-term inflation and projected inflation is important because high observed inflation rates make it likely that the demand for restoration of COLAs will increase. However, it is hard to see how the demands for restored COLAs will be financed if expected asset returns and real growth are low. The combination of increased benefits and low asset returns could be disastrous for public pension solvency .
What should public fund investment staff and trustees do? In the absence of wholesale pension reform, we see three practical steps that plans can take. First, investment professionals should more fully embrace stress tests (both macro and extreme equity market events), and develop contingency plans based on those stress tests. Second, staff and trustees should discuss projected returns in terms of risk premiums, not total returns . Finally, target returns should be an agreement between investment staff and state Treasurers, preferably with an independent third-party as arbiter (e.g., a state insurance commissioner). These discussions should be based on market prices - any deviations from market prices should be documented and justified, and should incorporate the same distinction between total returns and risk premiums.
Each of the steps outlined above are practical and feasible, and add transparency to the public fund investment process. In our view, these steps should be adopted regardless of whether further reform to public pensions are considered .
This document is for informational purposes only. This document is intended exclusively for the person to whom it has been delivered, and may not be reproduced or redistributed to any other person without the prior written consent of Navega Strategies LLC (“Navega”). The information contained herein is based on Nageva’s proprietary research analytics of data obtained from third party statistical services, company reports or communications, publicly available information, or other sources, believed to be reliable. However, Navega has not verified this information, and we make no representations whatsoever as to its accuracy or completeness. Navega does not intend to provide investment advice through this document. This document is in no way an offer to sell or a solicitation of an offer to buy any securities. Investing in securities involves risk of loss, including a loss of principal, that clients should be prepared to bear. Past performance is not indicative of future results, which may vary materially. While this summary highlights important data, it does not purport to capture all dimensions of risk. The methodology used to aggregate and analyze data may be adjusted periodically. The results of previous analyses may differ as a result of those adjustments. Navega has made assumptions that it deems reasonable and used the best information available in producing any calculations herein. Statements that are nonfactual in nature, including opinions, projections and estimates, assume certain economic conditions and industry developments and constitute only current opinions that could be incorrect and are subject to change without notice. All information provided herein is as of the delivery date the document (unless otherwise specified) and is subject to modification, change or supplement in the sole discretion of Navega without notice to you. This information is neither complete nor exact and is provided solely as reference material with respect to the services offered by Navega. Information throughout this document, whether stock quotes, charts, articles, or any other statement or statements regarding market or other financial information, is obtained from sources which we and our suppliers believe reliable, but we do not warrant or guarantee the timeliness or accuracy of this information. The information presented here has not been personalized, and is not based on the financial circumstances of the recipient. This information may not be applicable to your particular financial needs, and should not, by itself, be used to make determinations regarding the purchase or sale of securities, or other investment decisions.
The model performance information presented is based on the application of Navega’s factor analysis, backtested against actual historical data. “Backtesting” is a process of objectively simulating historical performance information by applying a set of rules backward in time. The results of the application of Navega’s model do not reflect actual performance or actual historical data. Such models are prepared with the full benefit of hindsight, and it is not likely that similar results could be achieved in the future.
The model portfolios were constructed by Navega with the benefit of hindsight to illustrate certain performance metrics. The performance shown was not actually achieved by any investor. The investments in these hypothetical portfolios were selected with the full benefit of hindsight, after performance over the period shown was known. It is not likely that similar results could not be achieved in the future. The hypothetical portfolios presented here are purely illustrative, and representative only of a small sample of possible scenarios.
The projections shown do not represent actual performance, and are based on assumptions which may not occur. It is possible that the markets will perform better or worse than shown in the projections, the actual results of an investor who invests in the manner these projections suggest will be better or worse than the projections, and an investor may lose money by relying on these projections.