Recent advances in artificial intelligence such as generative language processing (Chat GPT 4) have generated hype but also raised concerns about its economic and financial benefits. To grapple with these questions, our macro-consistent models and framework suggest focusing on the long-term and tracing the impact of AI on total factor productivity growth (TFP). Changes in TFP growth, in turn, effect long-term real GDP growth and portfolio returns. By contrast to recent misplaced commentaries overjoyed by the potential benefits of AI, our models reveal a more nuanced picture. A continuation of the current trend in AI, increasingly (excessively?) focused on labor displacing automation, is likely to erode TFP growth, real economic growth and portfolio returns in the long run. Conversely, investments in AI that target improving efficiency of current occupations, reallocation of resources, and developing new technologies could contribute to sustainable TFP growth, and hence higher long-term expected real growth and returns.
Let's recall that TFP growth measures both the direct impact of technological innovation on real economic growth through improved productivity, net of the effect of capital and labor, and the impact of resource reallocation efficiency across the economy. Investments in AI effect both channels. AI technology adopting firms could enhance their productivity, by improving the efficiency of current tasks or creating new, more productive tasks. The issue is whether these (potential) gains also ripple through the rest of the economy, as they did for the most part since the start of the industrial revolution and through the 20th century. It turns out that the recent trend of AI innovations that are excessively focused toward automation and increasingly displacing the existing workforce have led capital and labor reallocation efficiency losses across the economy at large, with losses that actually outweighed the realized mediocre improvements in productivity as displaced workers were for the most part reallocated to tasks that use labor less productively. Contrary to common (mis)perception, the net result of AI innovations could then be a loss in aggregate TFP growth.
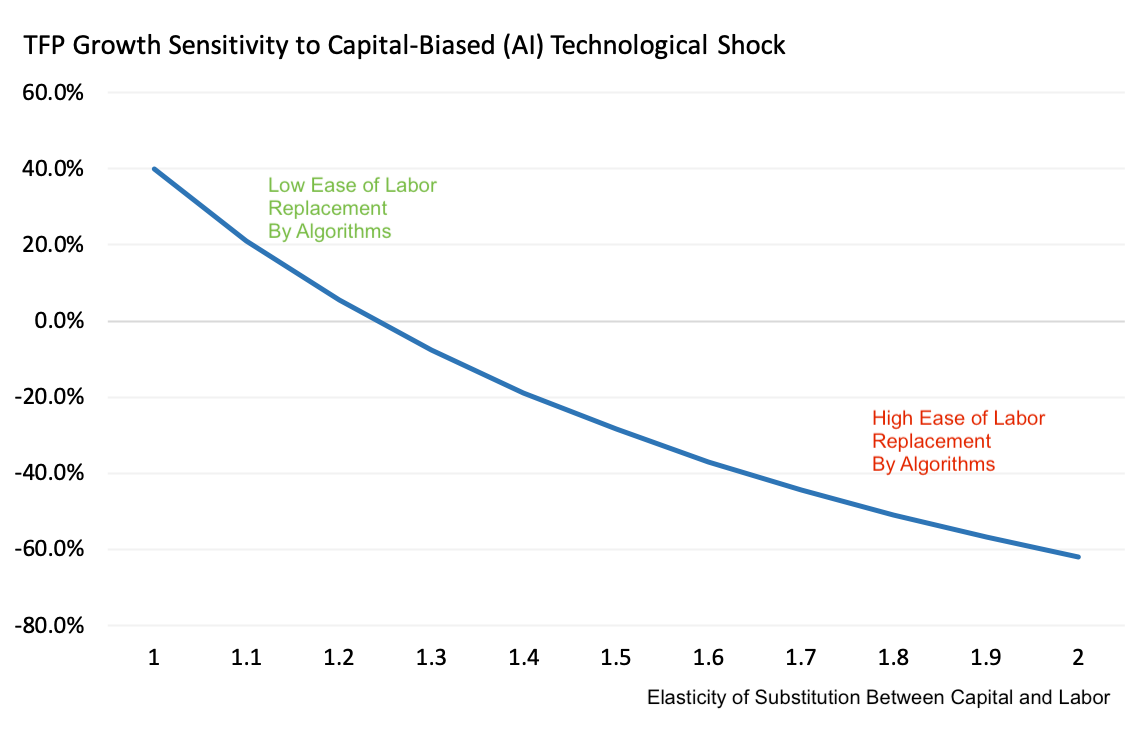
Exhibit 1 illustrates this point. The Exhibit shows how the sensitivity of TFP growth to technological shocks biased towards capital (i.e. AI) declines with the ease of replacing the labor force by capital (algorithms), without giving up on output . Economists measure this easiness by the elasticity of substitution between capital and labor. The greater this elasticity, the greater the incentive for firms that invest in AI technologies solely focused on automation to replace their labor workforce by algorithms, and the greater the negative ripple effect on aggregate TFP growth, as the displaced labor is being reallocated to less efficient jobs. Recent empirical studies estimate this elasticity of substitution between capital and labor to be about 1.5 . At such levels, Exhibit 1 indicates that investments in automation-driven AI could lead to a relative loss in TFP growth of about 30%! In turn, long-term real GDP growth could also be 30% lower (on a relative basis), assuming no change in the labor force growth.
Thus pervasive, negative effects of automation-driven AI innovations on long-term real economic growth prospects could be quantitatively significant. The next question then for long-term investors is the likely impact on future equity returns. To address this issue, we envision a worst case yet plausible scenario under which investments in new technology (about 0.5% of GDP per year) pursue their current trend over the next 10 years, primarily focusing on automation-driven AI. At the same time and over the same period, the income share of automation intensive firm increases from its current level of 20% to 40%, and the ease of labor replacement by algorithms increases, with a shift in the elasticity of substitution between capital and labor (from 1.5 to 2).
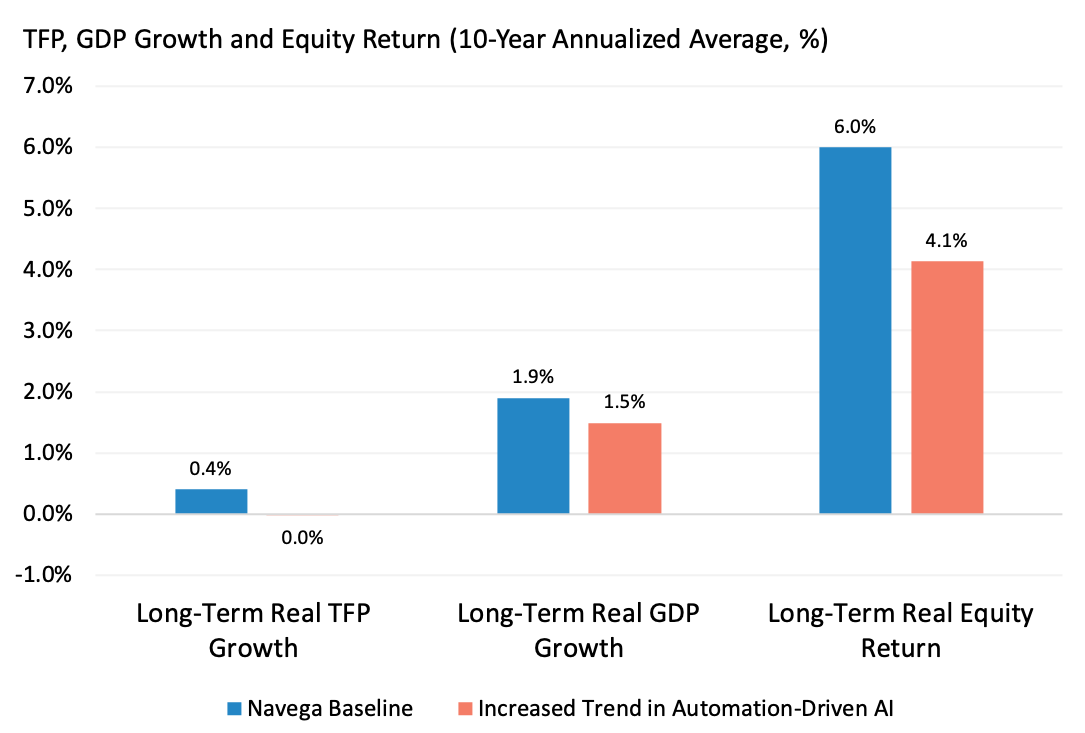
Exhibit 2 traces the scenario impact implied by our models on long-term TFP growth, long-term real GDP growth and long-term real equity returns. According to the Exhibit, long-term TFP growth would hover around an annualised average rate of zero over the next 10 years, a 40bps decline from our current baseline scenario. About half the decline can be attributed to the increased income share of automation intensive firms, while the remaining half can be attributed to the accelerated ease of labor replacement by algorithms. Framing this result in historical perspective, US TFP growth experienced a 100bps decline on average in the last 20 years. Our scenario analysis suggests that automation-driven AI could well have been a significant contributor to this experienced decline in TFP growth trend .
Assuming the labor force growth remains unchanged, long-term real GDP growth would also decline 40bps, to an annualised average of about 1.5%. As for the equity market, annualised average long-term real returns would materially decrease from 6% to about 4.2%. According to our models, this 180bps decline can be attributed to the impact of expected declines in real Treasury bond yields (40bps) and the impact of expected declines in real growth in dividend per share (140bps).
These results raise important issues for long-term investors. Somewhat paradoxically, provided we account for resource reallocation effects, not all types of AI technology innovations contribute positively to aggregate long-term TFP, real economic growth, and (balanced) portfolio returns, even if they (potentially) benefit the few firms that adopt the innovation.
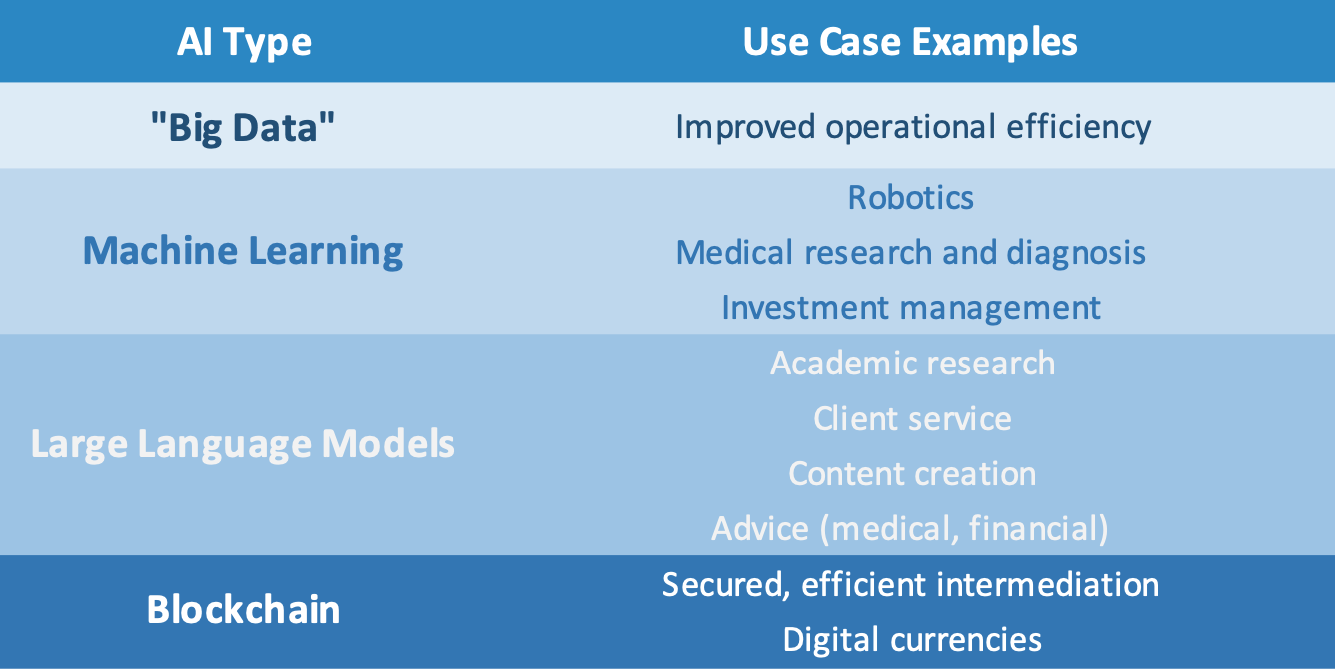
The takeaway then for investors is to dive deeper into firm (and consumer) level interactions to identify AI innovations likely to contribute positively and sustainably to long-term TFP growth. As suggested by Exhibit 3, a first step is to list the likely use cases. As a second step, our macro-consistent analytic framework can help trace the wider social, economic and portfolio return impact, accounting for reallocation effects. In addition, the likely environmental risk impact should also be evaluated. For instance, blockchain applications to digital (crypto) currencies are (to this date) highly energy intensive, with little or no prospective economic nor societal gains. Machine learning technologies for medical diagnostics and investment management seem promising, as long as the risk of data overfitting and misjudgment is effectively controlled. Finally, ChatGPT applications also seem fruitful, from enhancing productivity of academic researchers to helping advisors offer differentiated financial solutions to investors, provided they are not geared toward excessive automation, and the risk of disinformation and hallucinations is well managed.
This document is for informational purposes only. This document is intended exclusively for the person to whom it has been delivered, and may not be reproduced or redistributed to any other person without the prior written consent of Navega Strategies LLC (“Navega”). The information contained herein is based on Nageva’s proprietary research analytics of data obtained from third party statistical services, company reports or communications, publicly available information, or other sources, believed to be reliable. However, Navega has not verified this information, and we make no representations whatsoever as to its accuracy or completeness. Navega does not intend to provide investment advice through this document. This document is in no way an offer to sell or a solicitation of an offer to buy any securities. Investing in securities involves risk of loss, including a loss of principal, that clients should be prepared to bear. Past performance is not indicative of future results, which may vary materially. While this summary highlights important data, it does not purport to capture all dimensions of risk. The methodology used to aggregate and analyze data may be adjusted periodically. The results of previous analyses may differ as a result of those adjustments. Navega has made assumptions that it deems reasonable and used the best information available in producing any calculations herein. Statements that are nonfactual in nature, including opinions, projections and estimates, assume certain economic conditions and industry developments and constitute only current opinions that could be incorrect and are subject to change without notice. All information provided herein is as of the delivery date the document (unless otherwise specified) and is subject to modification, change or supplement in the sole discretion of Navega without notice to you. This information is neither complete nor exact and is provided solely as reference material with respect to the services offered by Navega. Information throughout this document, whether stock quotes, charts, articles, or any other statement or statements regarding market or other financial information, is obtained from sources which we and our suppliers believe reliable, but we do not warrant or guarantee the timeliness or accuracy of this information. The information presented here has not been personalized, and is not based on the financial circumstances of the recipient. This information may not be applicable to your particular financial needs, and should not, by itself, be used to make determinations regarding the purchase or sale of securities, or other investment decisions.
The model performance information presented is based on the application of Navega’s factor analysis, backtested against actual historical data. “Backtesting” is a process of objectively simulating historical performance information by applying a set of rules backward in time. The results of the application of Navega’s model do not reflect actual performance or actual historical data. Such models are prepared with the full benefit of hindsight, and it is not likely that similar results could be achieved in the future.
The model portfolios were constructed by Navega with the benefit of hindsight to illustrate certain performance metrics. The performance shown was not actually achieved by any investor. The investments in these hypothetical portfolios were selected with the full benefit of hindsight, after performance over the period shown was known. It is not likely that similar results could not be achieved in the future. The hypothetical portfolios presented here are purely illustrative, and representative only of a small sample of possible scenarios.
The projections shown do not represent actual performance, and are based on assumptions which may not occur. It is possible that the markets will perform better or worse than shown in the projections, the actual results of an investor who invests in the manner these projections suggest will be better or worse than the projections, and an investor may lose money by relying on these projections.