As Covid-19 rampant infections and fatalities continue their virulent spread, most countries have adopted drastic health and safety policies, including one- to two-month long strict social distancing and restrictions on non-essential businesses. In many cases, these policies have been combined with exceptional monetary and fiscal stimulus policies to help mitigate the impact on the real economy and financial markets.
The concern for investors is how effective these policies will be, given interrelated uncertainties about Covid-19 epidemiology – evolution of contagion and fatality rates, vaccine availability – policy options, size of and recovery time from economic shocks. The short-term economic impact over the next 3 months is likely to be severe according to the first macro indicators observed in China, France and the US, with a projected drop in real output similar or worse than the 2008 global financial crisis experience!
How about longer horizon effects? In these acutely challenging times, our view is that carefully designed scenario analyses can, nonetheless, help investors navigate through the fog. To be more specific, what matters for investors is how policies impact key drivers of long-term macro trends and macro uncertainty – labor force and total factor productivity (TFP) growth. For a given policy impact, our macro-based models can trace the effect of changes to these drivers on returns, yields, investment and savings decisions.
At the time of writing, Covid-19 policy driven scenarios may be framed around the central question of how to define a return to “normal” health and safety conditions, until a vaccine is found – possibly in the next 12-18 months, according to epidemiologists. Experiences in other countries (South Korea and Japan) indicate large-scale testing and tracking are necessary conditions to curb contagion and fatality rates, and maintain these below critical care capacity. In addition, in the US and Europe, a significant increase in adequate treatment facilities is required – including number of beds and medical equipment (ventilators) – to handle care load. In this context, the key issue seems to be the duration and effectiveness of social distancing measures, relative to the time it takes to reach acceptable health and safety conditions.
To illustrate, we consider the following three scenarios: a scenario consistent with our model baseline projections, a scenario leading to higher uncertainty about a lower long-term growth, and a worst case scenario that envisions a prolonged period of zero long-term growth. These scenarios are intended to illustrate one way to start to add some structure to discussions about the impact of Covid-19 policy on the economy and markets. Exhibit 1 shows the scenarios’ impact on the US economy and markets. Let’s examine these scenarios in turn:
In this scenario, acceptable health and safety conditions are met at the end of the 2-month social distancing period. At the same time, targeted fiscal policies mitigate impact on workers and businesses by compensating for loss in productivity. And targeted monetary policies mitigate impact on financing conditions (by extending credit lines to businesses for example). In other words, while the next quarter is likely to experience an extreme drop in real output, the assumption is that it reverts back within the next 12-18 months, leaving the long-term real economic growth trend and trend uncertainty mostly unchanged relative to our 2019 baseline model projections at 1.6% and 3.3%. In turn, according to our models, the long-term risk premium – or expected long-term difference between the equity market return and the 10-year government bond yield – also remains unchanged at 4.3%.
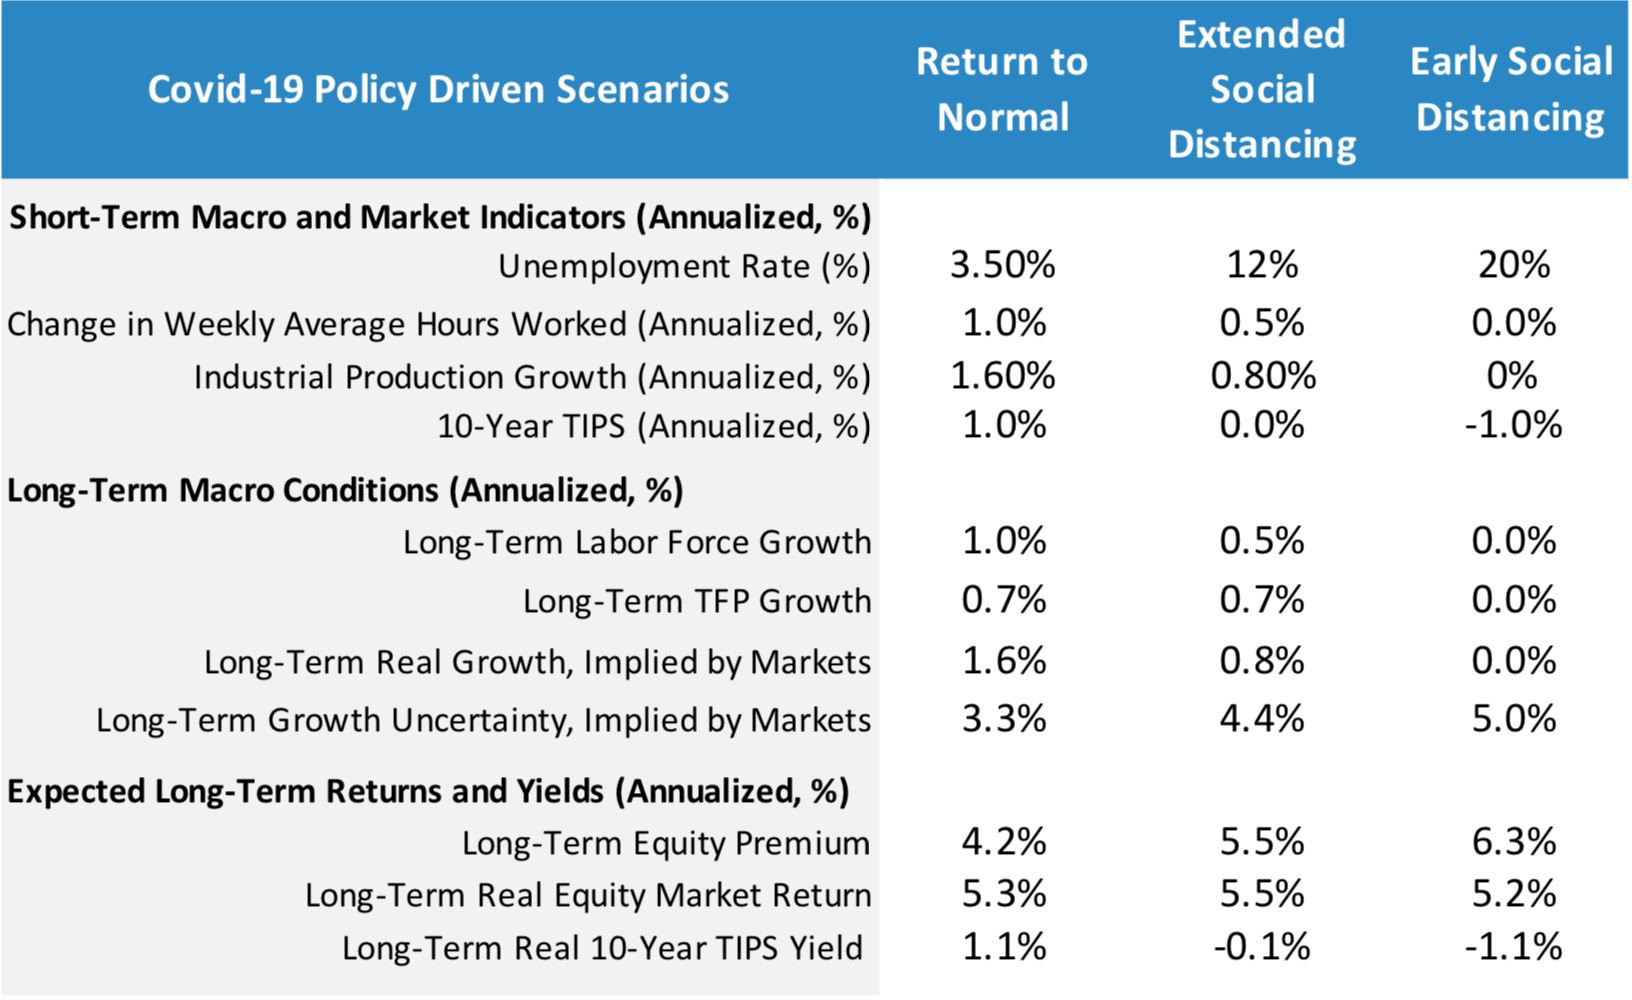
This scenario assumes return to normal conditions is delayed, requiring an additional month of strict social distancing and partial business shut-down measures. Fiscal policies fail to provide enough compensation for continued loss in productivity. However, monetary policies still manage to limit the impact on financing conditions. As shown in Exhibit 1, the likely short and longer term consequence could be similar to the 2008 GFC experience: unemployment rates shooting up to about 12% for almost a year, close to zero real yields, significant decline on trend (50bps) in labor force growth. As for TFP growth, it could still remain resilient mostly thanks to past (although moderate) gains in efficiency. Together, these macro conditions lead to much lower long-term trend growth (0.8%) and higher uncertainty (4.4%), and in turn, the risk premium increases 100bps to 5.5%.
In this disaster case, social distancing measures are relaxed too early, while conditions to allow smooth transition to return to normal are far from being met. As a result, policies are unable to contain the dire impact on health and the real economy. And even worse, they fail to provide clarity on next steps, leading to a loss of confidence and economic paralysis. To fix ideas, we modelled this scenario after the great depression experience: a prolonged period of economic disruption, with unemployment rates rising to extreme levels (20%), negative real yields – unlike the great depression, we assume continued monetary easing – near zero growth in the labor force, investment and industrial production. Taken together, these effects also lead to near zero growth in TFP, and zero growth in long-term real GDP. Calibrating our models to this scenario would lead to a further rise in long-term uncertainty (to about 5%). In turn, our model projects the equity risk premium to rise to 6.3%.
These are clearly unprecedented times for most people. They are unprecedented for two reasons: first, we have little collective information about this particular pandemic. Second, the pandemic and its policy responses introduce a significant new source of uncertainty into business and investment decision-making. In our view, the level of uncertainty around pandemic policy and policy responses is sufficiently high that it is premature to make specific forecasts about what will happen to the economy and markets over the next 12-18 months. We would suggest that investors continue monitor signals to changes in common knowledge of Covid-19 epidemiology, policy choices, and their impact on health conditions and the drivers of long-term growth and inflation. Material changes in perception call for updating and reviewing scenarios, and their implications for returns, yields and portfolio decisions. Subsequent notes will remain tuned to any changes, and explore scenarios for other major economies including China.
This document is for informational purposes only. This document is intended exclusively for the person to whom it has been delivered, and may not be reproduced or redistributed to any other person without the prior written consent of Navega Strategies LLC (“Navega”). The information contained herein is based on Nageva’s proprietary research analytics of data obtained from third party statistical services, company reports or communications, publicly available information, or other sources, believed to be reliable. However, Navega has not verified this information, and we make no representations whatsoever as to its accuracy or completeness. Navega does not intend to provide investment advice through this document. This document is in no way an offer to sell or a solicitation of an offer to buy any securities. Investing in securities involves risk of loss, including a loss of principal, that clients should be prepared to bear. Past performance is not indicative of future results, which may vary materially. While this summary highlights important data, it does not purport to capture all dimensions of risk. The methodology used to aggregate and analyze data may be adjusted periodically. The results of previous analyses may differ as a result of those adjustments. Navega has made assumptions that it deems reasonable and used the best information available in producing any calculations herein. Statements that are nonfactual in nature, including opinions, projections and estimates, assume certain economic conditions and industry developments and constitute only current opinions that could be incorrect and are subject to change without notice. All information provided herein is as of the delivery date the document (unless otherwise specified) and is subject to modification, change or supplement in the sole discretion of Navega without notice to you. This information is neither complete nor exact and is provided solely as reference material with respect to the services offered by Navega. Information throughout this document, whether stock quotes, charts, articles, or any other statement or statements regarding market or other financial information, is obtained from sources which we and our suppliers believe reliable, but we do not warrant or guarantee the timeliness or accuracy of this information. The information presented here has not been personalized, and is not based on the financial circumstances of the recipient. This information may not be applicable to your particular financial needs, and should not, by itself, be used to make determinations regarding the purchase or sale of securities, or other investment decisions.
The model performance information presented is based on the application of Navega’s factor analysis, backtested against actual historical data. “Backtesting” is a process of objectively simulating historical performance information by applying a set of rules backward in time. The results of the application of Navega’s model do not reflect actual performance or actual historical data. Such models are prepared with the full benefit of hindsight, and it is not likely that similar results could be achieved in the future.
The model portfolios were constructed by Navega with the benefit of hindsight to illustrate certain performance metrics. The performance shown was not actually achieved by any investor. The investments in these hypothetical portfolios were selected with the full benefit of hindsight, after performance over the period shown was known. It is not likely that similar results could not be achieved in the future. The hypothetical portfolios presented here are purely illustrative, and representative only of a small sample of possible scenarios.
The projections shown do not represent actual performance, and are based on assumptions which may not occur. It is possible that the markets will perform better or worse than shown in the projections, the actual results of an investor who invests in the manner these projections suggest will be better or worse than the projections, and an investor may lose money by relying on these projections.